Bitcoin Cash (BCH/USD) Price Faces Resistance Rallying
Estimated Reading Time: 3 minutes
Don’t invest unless you’re prepared to lose all the money you invest. This is a high-risk investment and you are unlikely to be protected if something goes wrong. Take 2 minutes to learn more
Bitcoin Cash Price Prediction – May 28
The recent BCH/USD market has embarked on a rallying movement to now face price resistance rallying at $800. As of the time of writing, the crypto trades at about a reduction of -0.94% at the market-worth of $757 level.
BCH/USD Market
Key Levels:
Resistance levels: $900, $1,100, $1,300
Support levels: $500, $400, $300
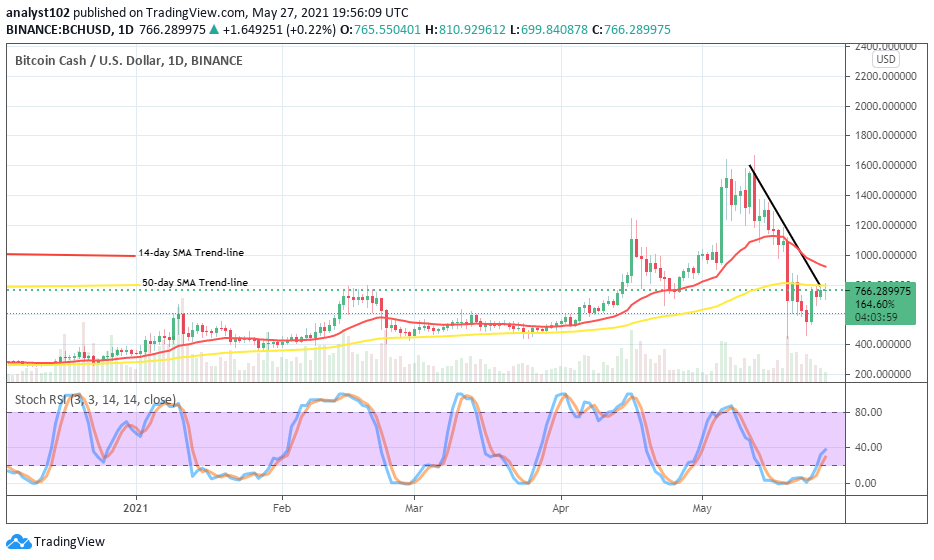
BCH/USD – Daily Chart
It is now revealed on the BCH/USD daily chart that the US Dollar has to some extent exhausted the recent depression it inflicted on Bitcoin cash. Hence, the base instrument has taken to rallying northwardly. There has been a featuring of candlesticks characterized by lower highs closely below the bigger SMA indicator at the level of $800 to ascertain the actual that price now faces resistance rallying in the market. The bearish trend-line drew across the 14-day SMA trend-line downward to touch the 50-day SMA at a lower point. The Stochastic Oscillators have moved northbound from the oversold region to seemingly attempting to cross the hairs near underneath range 40. That technically indicates that the crypto market may have to witness a pit stop in its currently embark rallying movement for a while.
BCH/USD price faces resistance rallying, will it drop again?
The rate at which the current BCH/USD price faces resistance rallying in the market seems not losing much energy to warrant an unduly or unnecessary panic sell-off trading situation by now. Bulls are probably relaxing for a while at that level of $800 for the time being. In the next active trading session, there may be a need to briefly bring down price for a better launch of upswing afterward.
On the downside, bears may still have a stronghold of the market close below the immediate resistance level of $900. A long less-active price movement around that point as well could in the run allow a return of downward forces to resurface in the crypto trading activities. Nevertheless, a close touch of the 50-day SMA by the 14-day SMA from the top, if not eventually breached to the south could mean to suggest that an upward move will be witnessed stemming from a lower point in no time.
BCH/BTC Price Analysis
It is depicted on the BCH/BTC price chart analysis that the base crypto has been pushing upward against the counter trading tool from a lower verge point of losing some of the upsides it previously achieved. The bullish trend-line is closely drawn below the 50-day SMA indicator as the 14-day SMA trend-line is located over them. And, price has sprung up to hover around the smaller SMA presently. The Stochastic Oscillators are now up from the oversold region to seemingly trying to close the hairs near range 40 to potentially suggest that the base current upswing will witness a less-impulsive movement for a while.
Note: new.cryptosignals.org is not a financial advisor. Do your research before investing your funds in any financial asset or presented product or event. We are not responsible for your investing results.