$SPONGE (SPONGE/USD) Surges as Bulls Dominate the Market
Estimated Reading Time: 3 minutes
Don’t invest unless you’re prepared to lose all the money you invest. This is a high-risk investment and you are unlikely to be protected if something goes wrong. Take 2 minutes to learn more

In a surprising turn of events in the $SPONGE market, the bulls have decisively broken through the bearish stronghold at the $0.000035 price level, triggering a significant surge. Remarkably, even the $0.00004 resistance level, which was likely targeted by bearish traders, fell swiftly in the bullish rally. The price peaked around $0.000045. To gain deeper insight, let us now examine the market indicators.
As Peter Brandt once said, “The market always tells a story. It’s our job to listen.” Now, let’s analyze the signals that tell the next chapter in this market.
Key Market Dynamics:
- Resistance Levels: $0.0010, $0.0011, $0.0012
- Support Levels: $0.000020, $0.0000195, $0.000019
$SPONGE (SPONGE/USD) Technical Outlook
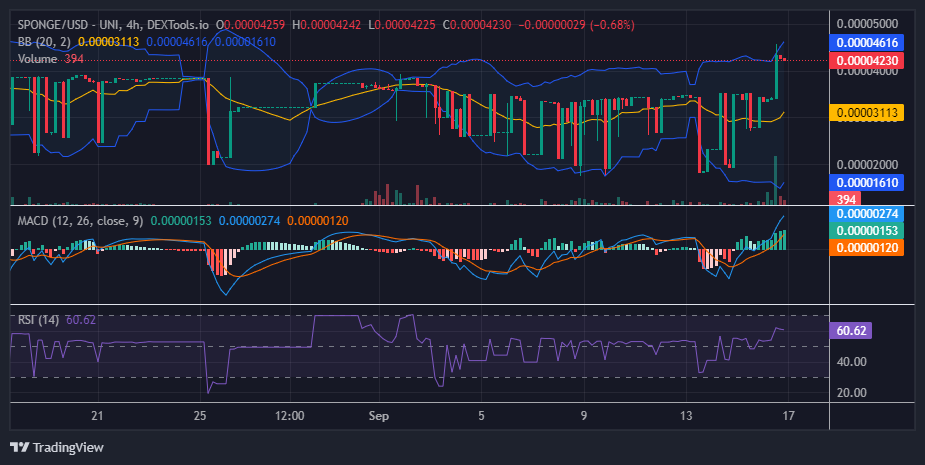
The bullish $SPONGE price movement has been significant, with the price topping above the $0.000045 level amid heightened market volatility. However, one concern for investors is the increased volatility triggered by the recent bullish surge. Despite expectations of a significant correction following the price peak, only a minor pullback has occurred from above the $0.000045 level.
It appears the bulls are finding and securing support above the $0.00004 level. Notably, if this bullish momentum (crypto signal) persists, the $0.000035 level—previously a stronghold for the bears—could now serve as a strong support. Based on the current chart outlook, if the price maintains these higher levels, market volatility may decrease, leading to an upward convergence of the lower standard deviation band in the Bollinger Bands indicator.
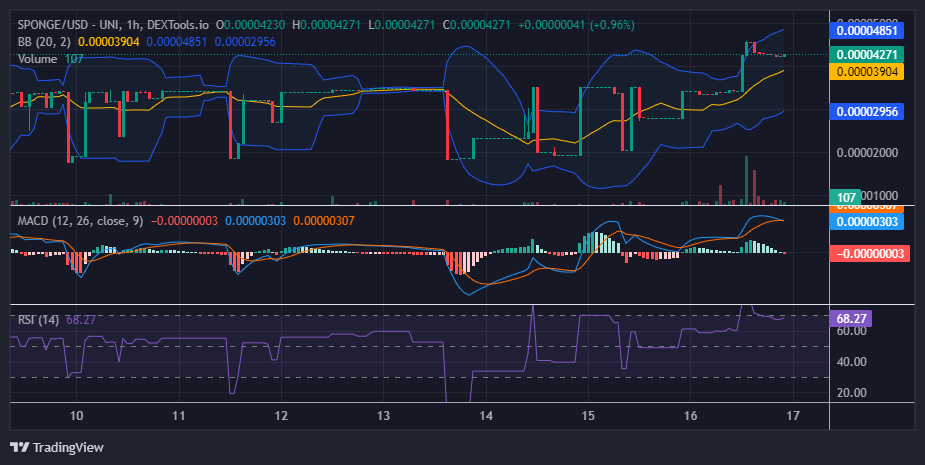
SPONGE/USD 1-Hour Chart Insights
The price action on the 4-hour chart shows an expanding Bollinger Bands formation, indicating increased volatility. On the smaller timeframes, both the lower and upper standard deviation bands are trending upward. Further reinforcing the bullish trend is the fact that after the price corrected from above the $0.000045 level, the price has consolidated around $0.0000427, suggesting that a support level may have formed at this point.
Buy SPONGE/USD!
Yeah #Bitcoin is cool.
But $SPONGE is cooler. 🧽💦 pic.twitter.com/175bQlioxD— $SPONGE (@spongeoneth) August 9, 2024
Join the SPONGE community and be part of the next big crypto sensation! Buy Sponge ($SPONGE) today!