$SPONGE (SPONGE/USD) Surges from Critical $0.00002 Support Level
Estimated Reading Time: 2 minutes
Don’t invest unless you’re prepared to lose all the money you invest. This is a high-risk investment and you are unlikely to be protected if something goes wrong. Take 2 minutes to learn more

Despite intermittent bullish surges, the $SPONGE token has remained confined within a narrow trading range of $0.000031 to $0.00004 for an extended period. Once again, the price was rejected at the resistance near the $0.00004 level. Bullish traders were unable to sustain the upward momentum at the $0.000035 level, leading to a decline to the $0.00002 support. From this point, the market has begun to rally once again.
Key Market Dynamics:
- Resistance Levels: $0.0010, $0.0011, $0.0012
- Support Levels: $0.000020, $0.0000195, $0.000019
$SPONGE (SPONGE/USD) Technical Outlook
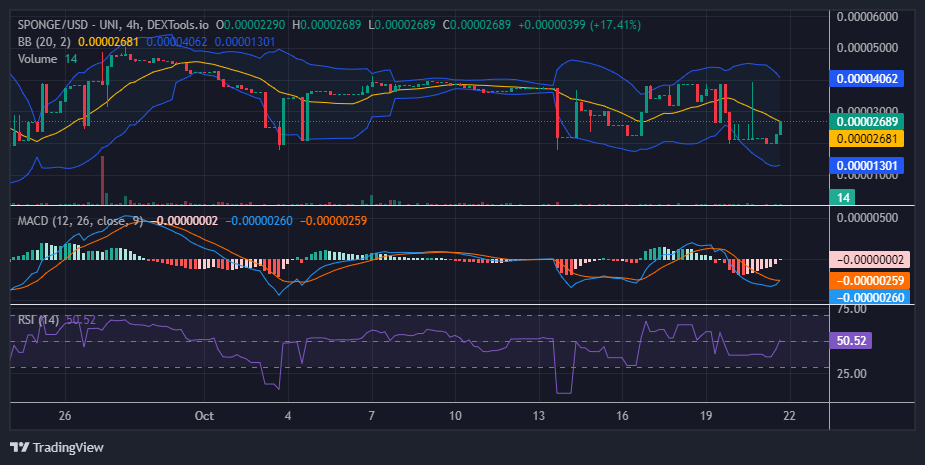
The previous analysis of the $SPONGE market indicated a flattening in price action due to exhaustion near the $0.000039 level, just below the key resistance at $0.00004. However, the crypto signal has since fallen toward the critical support level of $0.00002. Despite this drop, market volatility remains high, as evidenced by the Bollinger Bands maintaining a wide bandwidth, suggesting continued significant price swings. Indicators currently point to a rapid bullish recovery, with the price now at $0.000027 and the upward momentum gaining traction.
SPONGE/USD 1-Hour Chart Insights
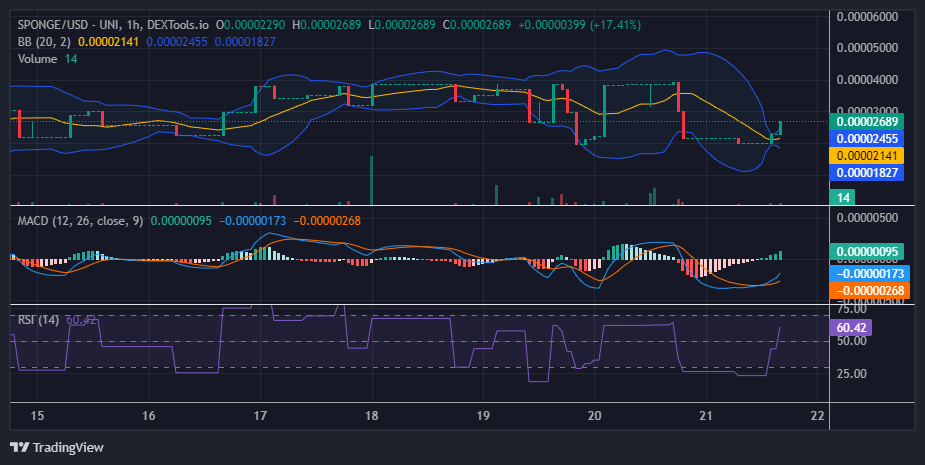
From the perspective of the 1-hour chart, a bullish recovery is also underway. Volatility has eased slightly, reducing the frequency of oscillations within the key horizontal price channel. If SPONGE/USD maintains this narrower bandwidth, the market may soon rally back above the $0.000035 level. Additionally, the Moving Average Convergence Divergence (MACD) indicator has already shown a bullish crossover below the zero line, reinforcing the ongoing recovery.
Buy SPONGE/USD!
Crypto bros calling moonshots early pic.twitter.com/E4PTSpYJYO
— $SPONGE (@spongeoneth) October 19, 2024
Join the SPONGE community and be part of the next big crypto sensation! Buy Sponge ($SPONGE) today!