Dogecoin (DOGE) Price Prediction: DOGE/USDT Leans Towards a Key Support
Estimated Reading Time: 3 minutes
Don’t invest unless you’re prepared to lose all the money you invest. This is a high-risk investment and you are unlikely to be protected if something goes wrong. Take 2 minutes to learn more

Date: August 18, 2025
The Dogecoin market has been heading toward the $0.2500 price level but has faced a major setback in the ongoing session. Nevertheless, price action can still be seen hovering above a key support level. A breach of the mentioned support may signal a steeper decline.
DOGE/USDT Long-Term Trend — Bullish (Daily Chart)
Key Price Levels:
Resistance: $0.2500, $0.2750, $0.3000
Support: $0.2200, $0.1950, $0.1700
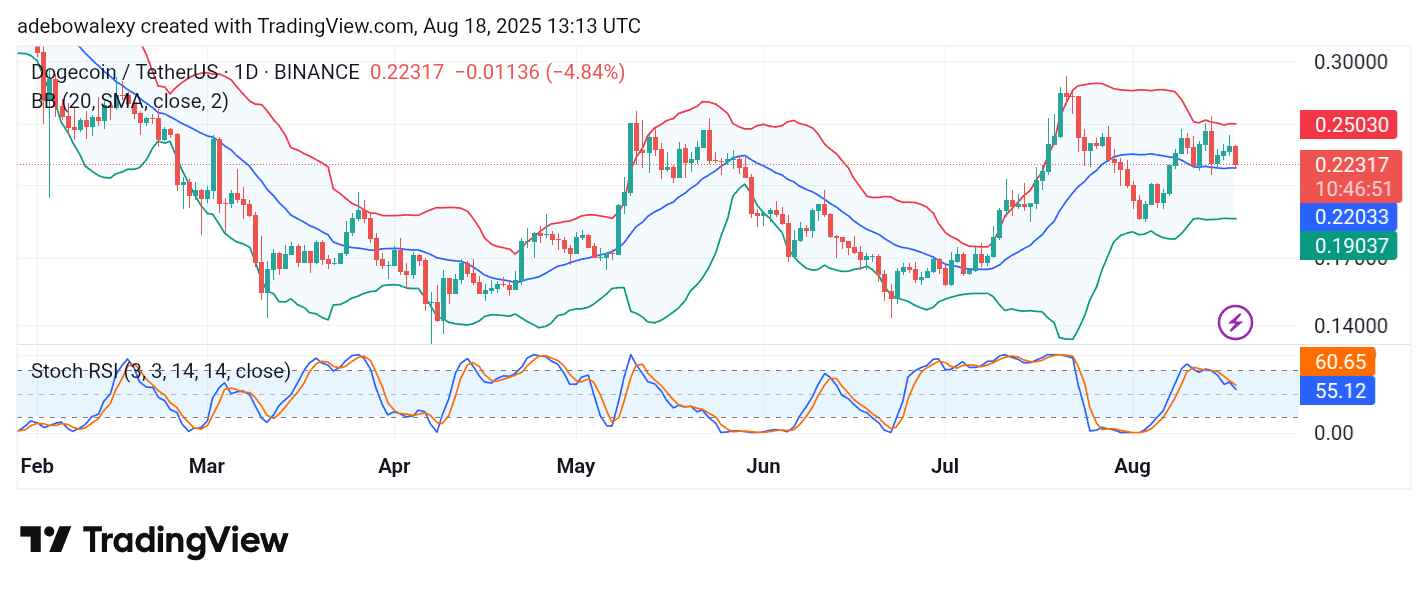
The Dogecoin market had gathered modest gains toward the $0.2500 ceiling. However, the ongoing session has appeared as a red price candle. Consequently, the market has dipped toward the middle limit of the Bollinger Bands (BB) indicator. Meanwhile, the BB indicator maintains a sideways orientation as the ongoing session tests support at the middle BB band. The Stochastic Relative Strength Index (SRSI) lines have continued a downward path following the failure of an upside crossover.
Dogecoin (DOGE) Price Prediction: DOGE/USDT Stays Protected
While Dogecoin’s price action remains above the middle limit of the BB indicator, it can be said that bullish sentiment stays protected. However, the latest price candle has introduced a notable decline, raising significant concerns.
To that effect, the SRSI indicator lines have continued their downward movement after an attempted upward crossover failed. Consequently, this raises concerns of sustained bearish sentiment in the market. Still, traders should watch for a breach of the BB indicator’s mid-band for further confirmation.
Dogecoin (DOGE) Price Prediction: DOGE/USDT Retains Vulnerability (4-Hour Chart)
Price action has descended to the lowest band of the BB indicator on the 4-hour chart. However, the previous session rebounded slightly, though the move was minimal. The ongoing session, by contrast, presents a much brighter bullish signal.
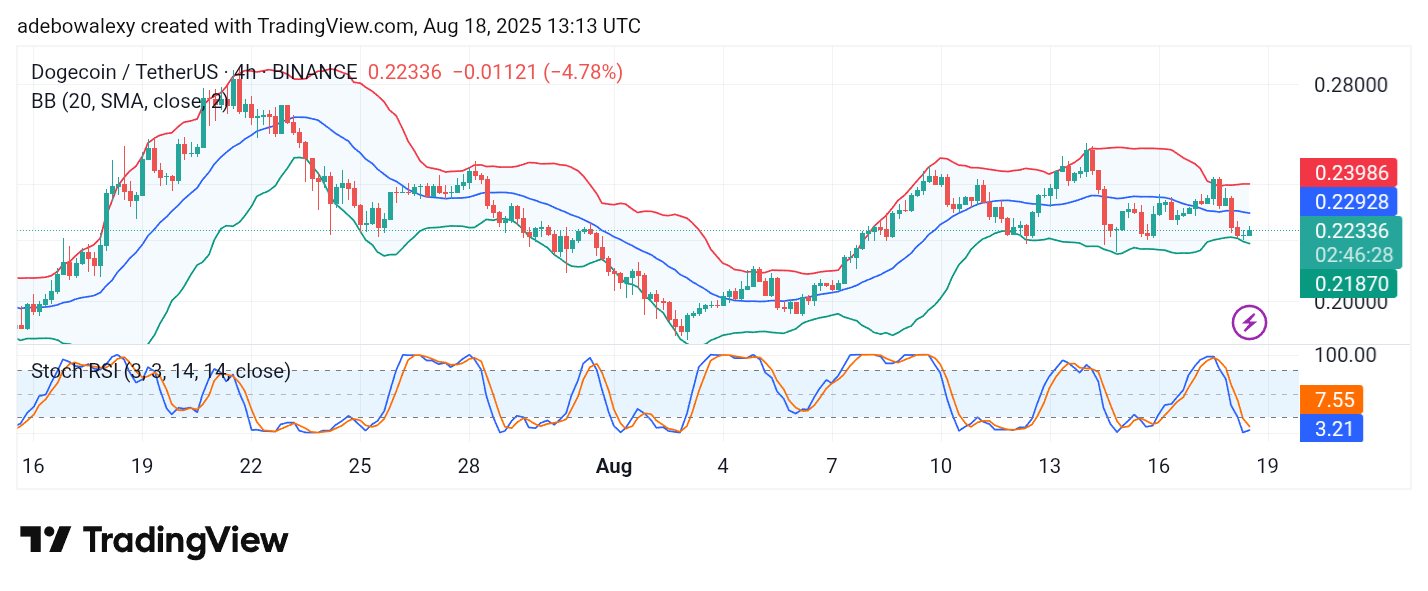
The SRSI lines can be seen converging for an upward crossover deep in the oversold region. Nonetheless, since price action remains below the middle limit of the BB indicator, traders may want to wait until the market surpasses the $0.2293 level for stronger confirmation of a bullish recovery.