$SPONGE (SPONGE/USD) Sustains Strong Support Above $0.00003
Estimated Reading Time: 3 minutes
Don’t invest unless you’re prepared to lose all the money you invest. This is a high-risk investment and you are unlikely to be protected if something goes wrong. Take 2 minutes to learn more

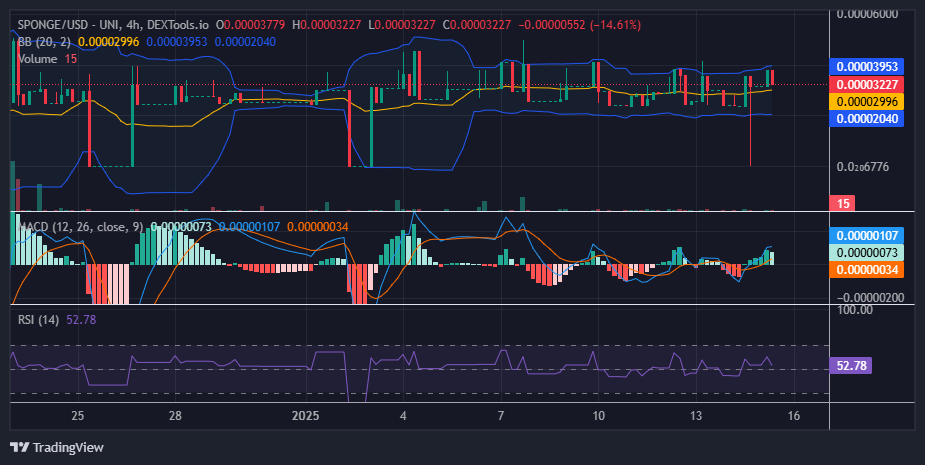
The SPONGE/USD pair is currently consolidating within a defined range, with buyers successfully defending the critical $0.00003 support level. The previous market analysis highlighted a significant surge above this key level, and the pair has managed to sustain its position above it throughout subsequent trading sessions. This resilience underscores the market’s strength in maintaining an upward trajectory and suggests the potential for further price increases toward higher levels.
Key Market Dynamics:
- Resistance Levels: $0.00005, $0.000055, $0.000060
- Support Levels: $0.000020, $0.0000195, $0.000019
$SPONGE (SPONGE/USD) Technical Analysis
The indicators suggest a consolidating market, as evidenced by the sideways movement of the Bollinger Bands. However, there is a notable upward pressure on the upper band of the Bollinger Bands indicator, driven by increasing bullish activity. The Moving Average Convergence and Divergence (MACD) indicator also confirms consolidation, with the positive and negative histograms oscillating closer to the zero line. The diminishing amplitude of these swings further signals a consolidating crypto market.
Despite this, the Bollinger Bands reveal a slight bullish bias as the upper standard deviation responds to buyer activity. While the current session reflects a strong correction, the SPONGE/USD market price remains above the 20-day moving average, indicating that the bulls still hold a slight advantage in this market.
$SPONGE 1-Hour Chart Observations
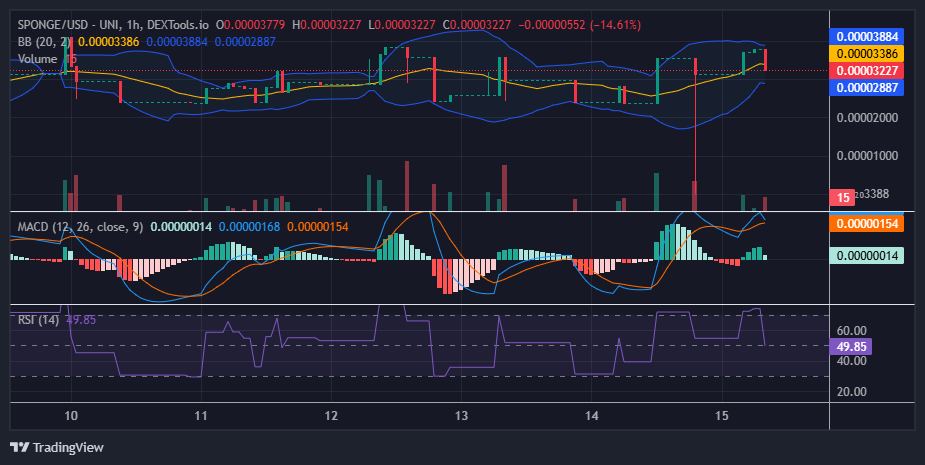
The correction in the SPONGE/USD market, appearing stronger on smaller timeframes, may create some apprehension among traders. However, it is important to note that as long as the market remains above the $0.00003 support level, the strength of the bulls remains evident.
Currently trading at $0.000032, the market is depicted by the Relative Strength Index (RSI) to be in equilibrium, with the RSI reading at 49.85. This price level reflects the determination and optimism of bullish traders striving to push the market upward.
Additionally, the Bollinger Bands are converging, indicating reduced volatility due to the resilience of buyers. This convergence may signal an imminent significant price movement, with the potential for an upside breakout.
Buy $SPONGE!
You smell dat DAMP? 💦 pic.twitter.com/tbyS93OvuK
— $SPONGE (@spongeoneth) January 12, 2025
Join the SPONGE community and be part of the next big crypto sensation! Buy Sponge ($SPONGE) today!