$SPONGE (SPONGE/USD) Tug-of-War Continues, Bulls Remain Resilient
Estimated Reading Time: 3 minutes
Don’t invest unless you’re prepared to lose all the money you invest. This is a high-risk investment and you are unlikely to be protected if something goes wrong. Take 2 minutes to learn more

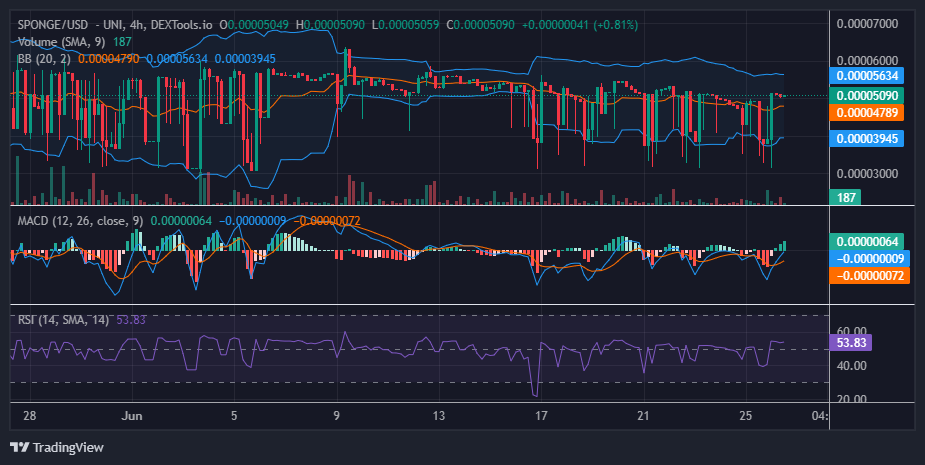
The battle between bulls and bears continues in the SPONGE/USD market. In our last analysis, we observed that the price action found support at the key level of $0.000038. However, the market has since rebounded upward, with bears now appearing to gain strength as the resistance has shifted slightly downward. The resistance level is currently around $0.000051; before, it was around $0.000055. While this may be discouraging for bullish traders, it is important to examine the indicators to better understand the market conditions.
Key Market Dynamics:
- Resistance Levels: $0.0010, $0.0011, and $0.0012
- Support Levels: $0.000035, $0.000030, and $0.000025
$SPONGE (SPONGE/USD) Technical Analysis Unveils Bullish Tenacity
Although the SPONGE/USD market has appeared to range sideways for an extended period, the bearish trend has gradually gained ground. This is evidenced by the slight downward shift in the resistance level from $0.000055. However, considering the Moving Average Convergence and Divergence (MACD) indicator alongside the price action, we observe a bullish divergence. The MACD suggests that bearish momentum may be weakening, indicating that the price action might be seeking support at the current level. Traders should therefore anticipate a potential bounce around the $0.00005 threshold. If this level holds as support, it could signal a significant upward movement in the crypto market.
Nevertheless, the Bollinger Bands indicate strong market volatility, which could threaten the ongoing bullish development. It is crucial to monitor the market closely around the $0.00005 level.
$SPONGE 1-Hour Chart Insights
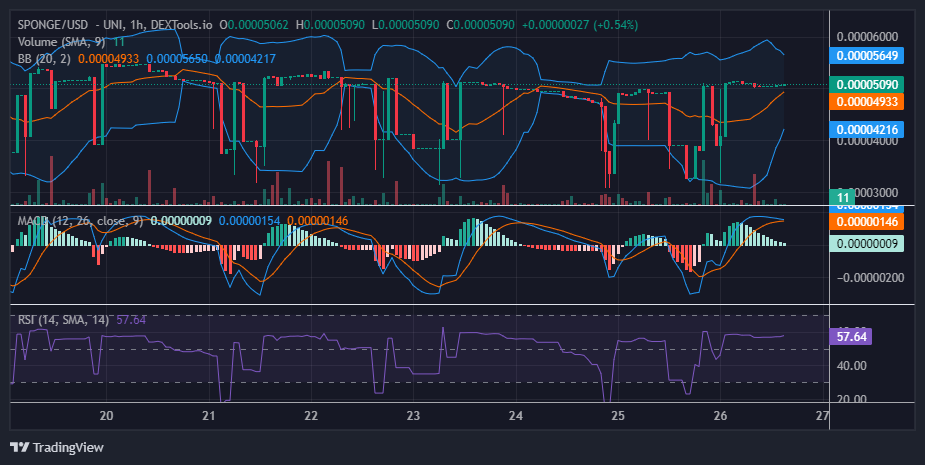
The market continues to range around the $0.000051 price level as the Bollinger Bands converge around the price action. This convergence indicates a decline in market volatility, which may currently benefit the bullish side. Reduced volatility suggests ongoing consolidation at the critical $0.00005 level, potentially strengthening it as a support level. This support could facilitate a price bounce.
Buy $SPONGE!
MOOD 🧽💦 pic.twitter.com/JIeWVTKGqp
— $SPONGE (@spongeoneth) June 26, 2024
Invest in the hottest and best meme coin. Buy Sponge ($SPONGE) today!