SPONGE/USD ($SPONGE) Bulls Still Have the $0.00011 Price Level in Sight
Estimated Reading Time: 3 minutes
Don’t invest unless you’re prepared to lose all the money you invest. This is a high-risk investment and you are unlikely to be protected if something goes wrong. Take 2 minutes to learn more
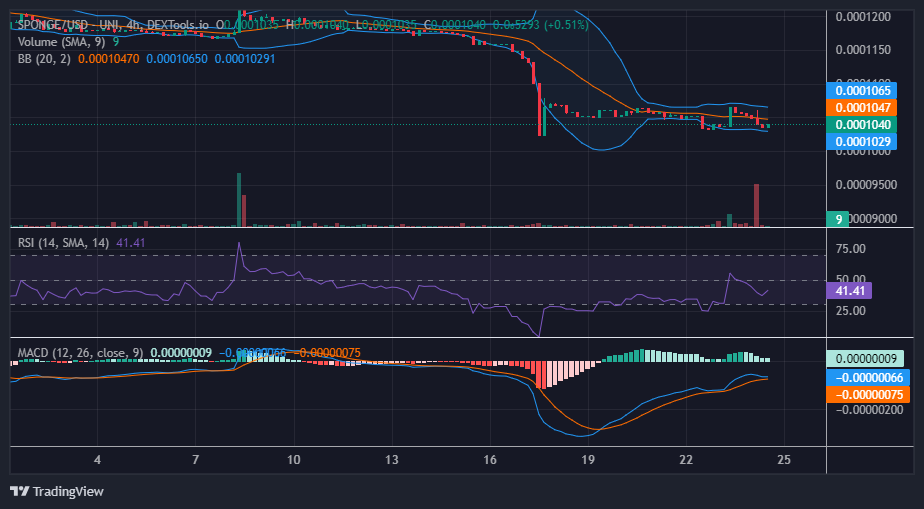
Since August 18, the SPONGE/USD market has been experiencing a prolonged period of stagnation, with the price maintaining a relatively stable level around $0.0001051. However, starting on August 22, a significant shift occurred as the bear market managed to push the price down to $0.0001031. This movement broke the deadlock and introduced some volatility into the market, allowing the bears to gain momentum.
Subsequently, the price rebounded from the $0.0001031 level and managed to climb to a resistance price of $0.0001065. This movement indicated a struggle between the bulls and bears for control of the market’s direction.
Key Levels
- Resistance: $0.0004, $0.0045, and $0.0005.
- Support: $0.00011, $0.00010, and $0.00009.
Sponge (SPONGE/USD) Price Analysis: The Indicators’ Point of View
Despite the recent SPONGE/USD price fluctuations, it’s evident that the market has not yet committed to a distinct direction. The widening of the price channel indicates increased volatility and uncertainty. The market is currently caught in a tug-of-war between buyers and sellers, with neither side able to establish a dominant trend.
The volume of trade indicator played a crucial role in analyzing recent market activity. The first 4-hour trading session following the new developments displayed a significant histogram on the volume of trade indicator. This suggests that there was a substantial amount of trading activity during this period.
However, it’s important to note that the actual candlestick pattern for this session was an inverted hammer. This discrepancy indicates a potential disconnect between trading volume and price movement. It might suggest that despite the high volume, the price didn’t move significantly, which could hint at indecision or conflicting sentiments in the market.
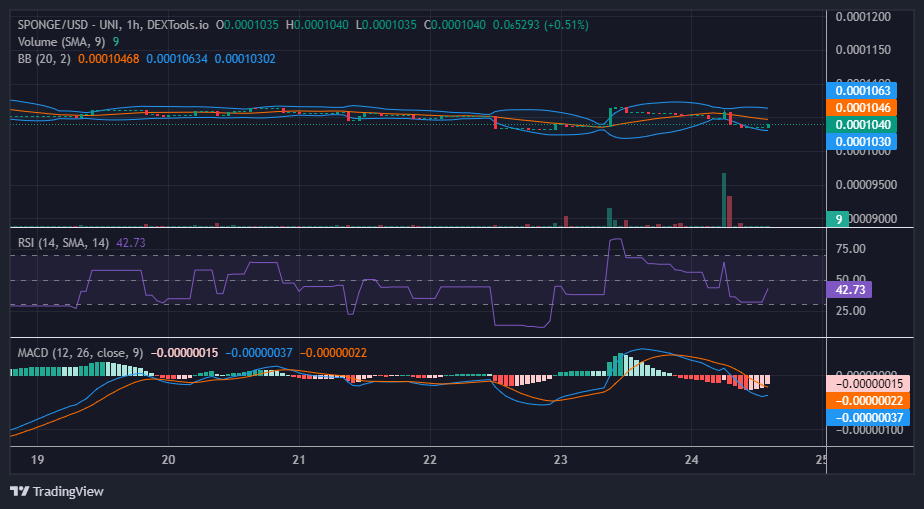
$SPONGE Short-Term Outlook: 1-Hour Chart
Despite the temporary price rebound, the overall market sentiment remains in the bearish zone. This is supported by various technical indicators that suggest selling pressure is still present. It’s crucial to monitor these indicators to identify any potential shifts in sentiment.
However, the Moving Average Convergence and Divergence (MACD) indicator could potentially be providing a glimmer of hope, as the diminishing faded red negative histograms indicate a reduction in height. Additionally, the MACD line shows signs of recovery and is turning towards crossing out of the bearish zone.
Buy the Sponge token today!
The perfect drawing doesn’t exist, yes it does… 😉🎨 pic.twitter.com/xbhi2KJ4Ye
— $SPONGE (@spongeoneth) August 24, 2023
Invest in the hottest and best meme coin. Buy Sponge ($SPONGE) today!