Sponge/USD ($SPONGE) Continues Its Resilient Bullish Rebound
Estimated Reading Time: 3 minutes
Don’t invest unless you’re prepared to lose all the money you invest. This is a high-risk investment and you are unlikely to be protected if something goes wrong. Take 2 minutes to learn more

The $SPONGE market has consistently sustained its bullish recovery, resiliently facing resistance at the $0.0000938 level. The ongoing bull market has encountered a notable concentration of sell orders at this level, yet the steadfast support at $0.0000932 has effectively maintained the market’s upward trajectory, exerting pressure on bearish sentiment encircling the $0.0000938 price point.
Key Price Levels
- Resistance: $0.000115, $0.000120, and $0.000125.
- Support: $0.000090, $0.000080, and $0.000085.
Sponge (SPONGE/USD) Price Analysis: Technical Insights
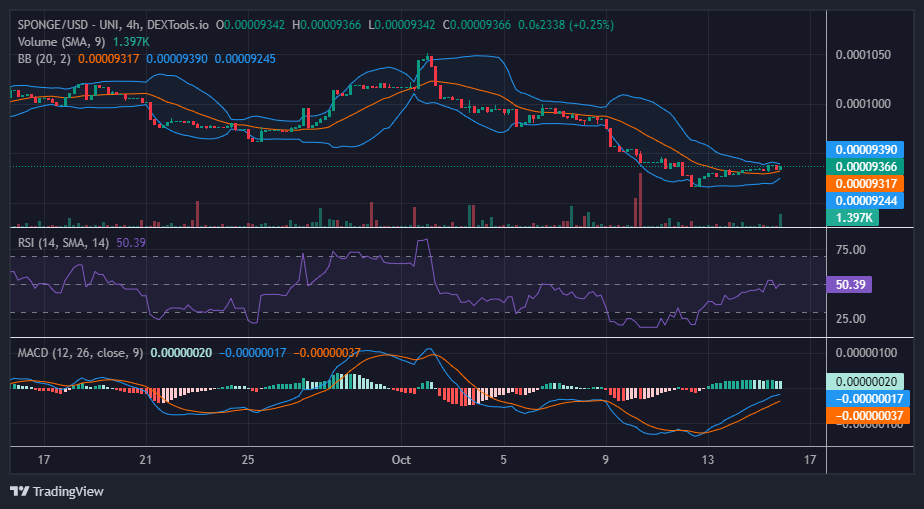
The indicators employed in this analysis consistently illustrate the $SPONGE market’s ongoing bullish trajectory. Despite a seemingly gradual pace, the bull market maintains a steady course. Notably, the Bollinger Bands have failed to exhibit increased volatility, which can be attributed to the resistance encountered at the $0.0000938 level.
Moreover, the Relative Strength Index (RSI) currently positions the market at a midpoint, signifying a balanced stance between bullish and bearish forces. These indicators collectively reflect the market’s ongoing struggle against the prevailing resistance.
While the market oscillates around the 50 level in the RSI, the histograms within the Moving Average Convergence and Divergence (MACD) indicate a decline in bullish momentum. This suggests a complex interplay of factors affecting the market’s dynamics.
$SPONGE Short-Term Outlook: 1-Hour Chart
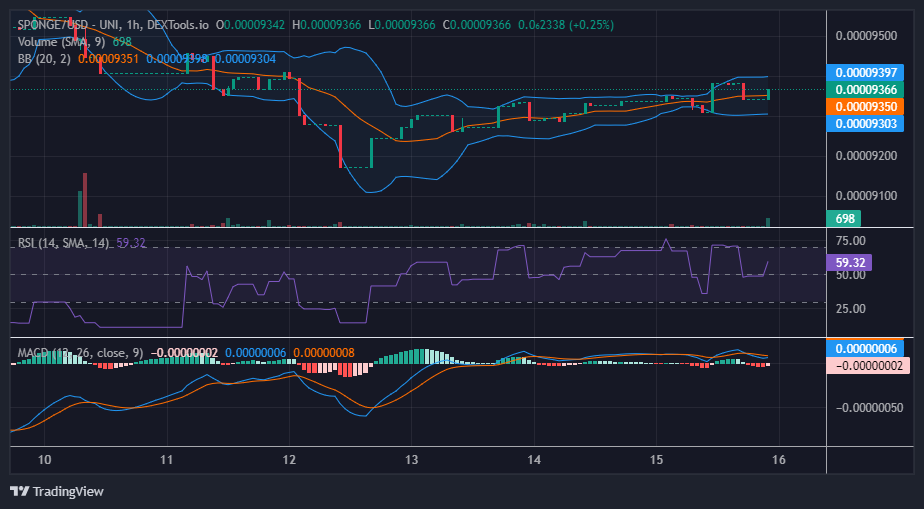
Upon closer examination of the shorter timeframe, it becomes evident that the $SPONGE market is in a recovery phase, characterized by a strong bullish candlestick pattern accompanied by significant volumes in the trade histograms. This development follows the successful establishment of a higher support level at $0.00009338 by the bulls.
The market is now poised in pursuit of the $0.00009384 resistance level. Despite encountering this near-term hurdle, SPONGE/USD continues to demonstrate an overall upward trend.
Buy SPONGE/USD and soak up the damp!
When you’re around people who don’t own any $SPONGE 🧽#Sponge #Crypto #Alts #Airdrop pic.twitter.com/6l4xf00Rzl
— $SPONGE (@spongeoneth) October 16, 2023
Invest in the hottest and best meme coin. Buy Sponge ($SPONGE) today!