SPONGE/USD ($SPONGE) Market Snapshot: Bulls Steady at Key $0.0001 Threshold
Estimated Reading Time: 3 minutes
Don’t invest unless you’re prepared to lose all the money you invest. This is a high-risk investment and you are unlikely to be protected if something goes wrong. Take 2 minutes to learn more

The SPONGE/USD pair continues to showcase a battle-tested support at the $0.0001 level, where price action has remained firmly grounded. Following a brief upward spike that touched $0.00011, the market retraced modestly, but hasn’t broken below its familiar base—suggesting ongoing strength beneath the surface.
This prolonged sideways movement could be signaling silent accumulation by savvy traders positioning ahead of a possible surge. The fact that SPONGE has repeatedly respected the $0.0001 zone hints at a strong floor that may act as a springboard for the next bullish advance.
Key Levels to Watch
- Resistance: $0.000110, $0.00012, $0.00013
- Support: $0.000090, $0.0000850, $0.00008
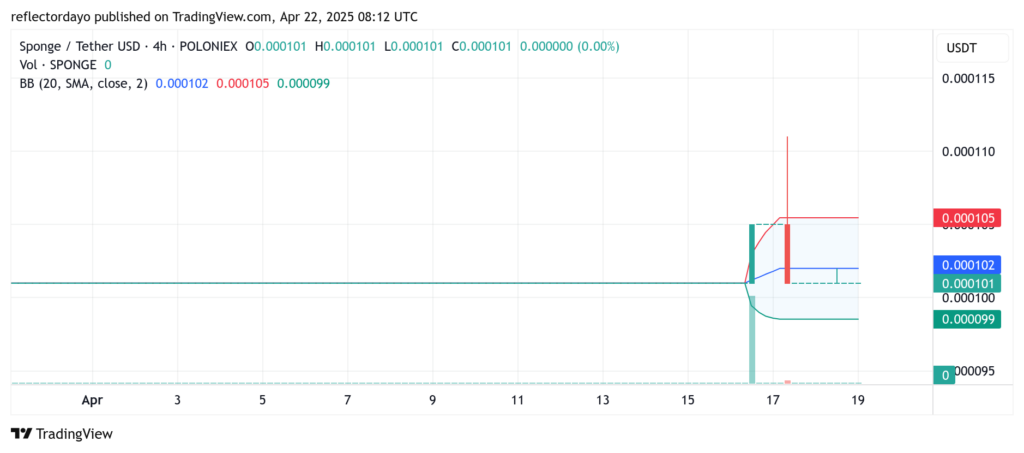
SPONGE/USD Technical Setup: Pressure Builds for a Bullish Break
SPONGE’s current structure mirrors past setups that preceded significant upward moves. Anchored around $0.0001—a level loaded with historical significance—the market is primed for a shift. If buyers can push and hold the price above $0.000105, it would not only establish a new higher low but also serve as confirmation of growing bullish momentum.
Such a development could trigger a renewed wave of interest, transforming this consolidation into the base for a fresh rally.
If historical patterns repeat, this quiet phase may soon give way to a sharp move. With accumulation potentially underway, this could represent a strategic entry point for buyers anticipating a breakout.
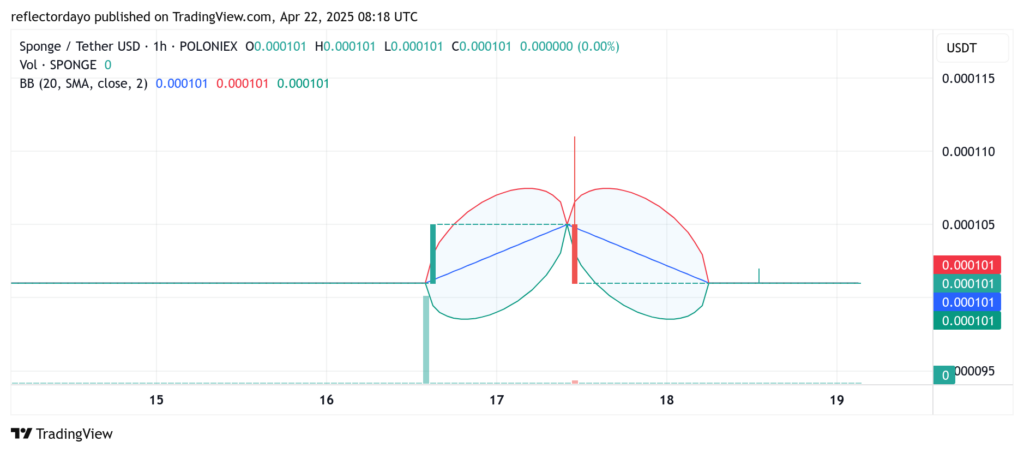
$SPONGE 1-Hour Chart Insight: Bollinger Band Squeeze Prepares Market for a Move
Zooming into the 1-hour chart, technical signals are aligning for a possible breakout. Bollinger Bands are compressing tightly around the $0.0001 area, often a precursor to heightened volatility. The narrowing of the bands—along with the flattening 20-period moving average—reflects the current equilibrium between buyers and sellers.
Historically, these low-volatility zones are followed by explosive price action. With signs pointing to accumulation under the radar, this might be a golden setup for bulls planning to catch the next breakout before it unfolds.
Buy SPONGE/USD!
POV: You faded again pic.twitter.com/bJ2oa1Abbr
— $SPONGE (@spongeoneth) April 21, 2025
Join the SPONGE community and get in on the next big crypto opportunity! Buy Sponge ($SPONGE) today