SPONGE/USD ($SPONGE) Outlook: Signs of a Possible Rebound
Estimated Reading Time: 2 minutes
Don’t invest unless you’re prepared to lose all the money you invest. This is a high-risk investment and you are unlikely to be protected if something goes wrong. Take 2 minutes to learn more

The $SPONGE market recently slipped beneath the key $0.00009 support level, extending losses toward $0.000085 as bearish momentum weighed on the market. While the breakdown signaled short-term weakness, technical indicators suggest that conditions may be shifting in favor of a rebound.
Critical Price Levels
-
Resistance: $0.000115, $0.000120, $0.000130
-
Support: $0.000085, $0.000080, $0.000075
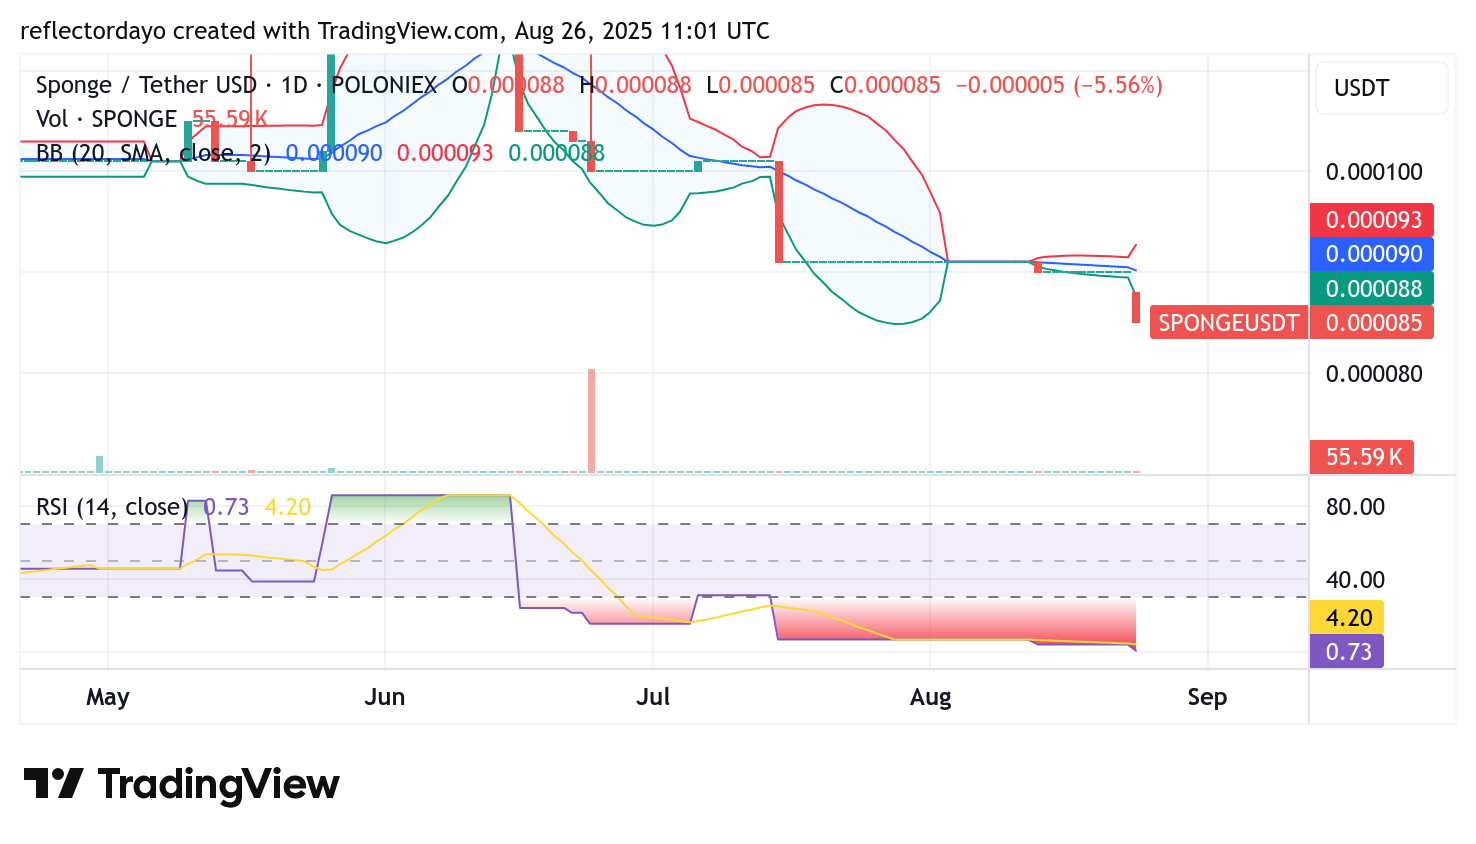
SPONGE/USD Daily Chart: RSI Suggests Market Recovery Potential
The daily timeframe reveals that $SPONGE has moved firmly into oversold territory, as reflected by the RSI. This extreme condition in the crypto signal often precedes corrective upward movement, especially when paired with rising volatility. These dynamics may provide traders with a window for strategic accumulation before a possible reversal unfolds.
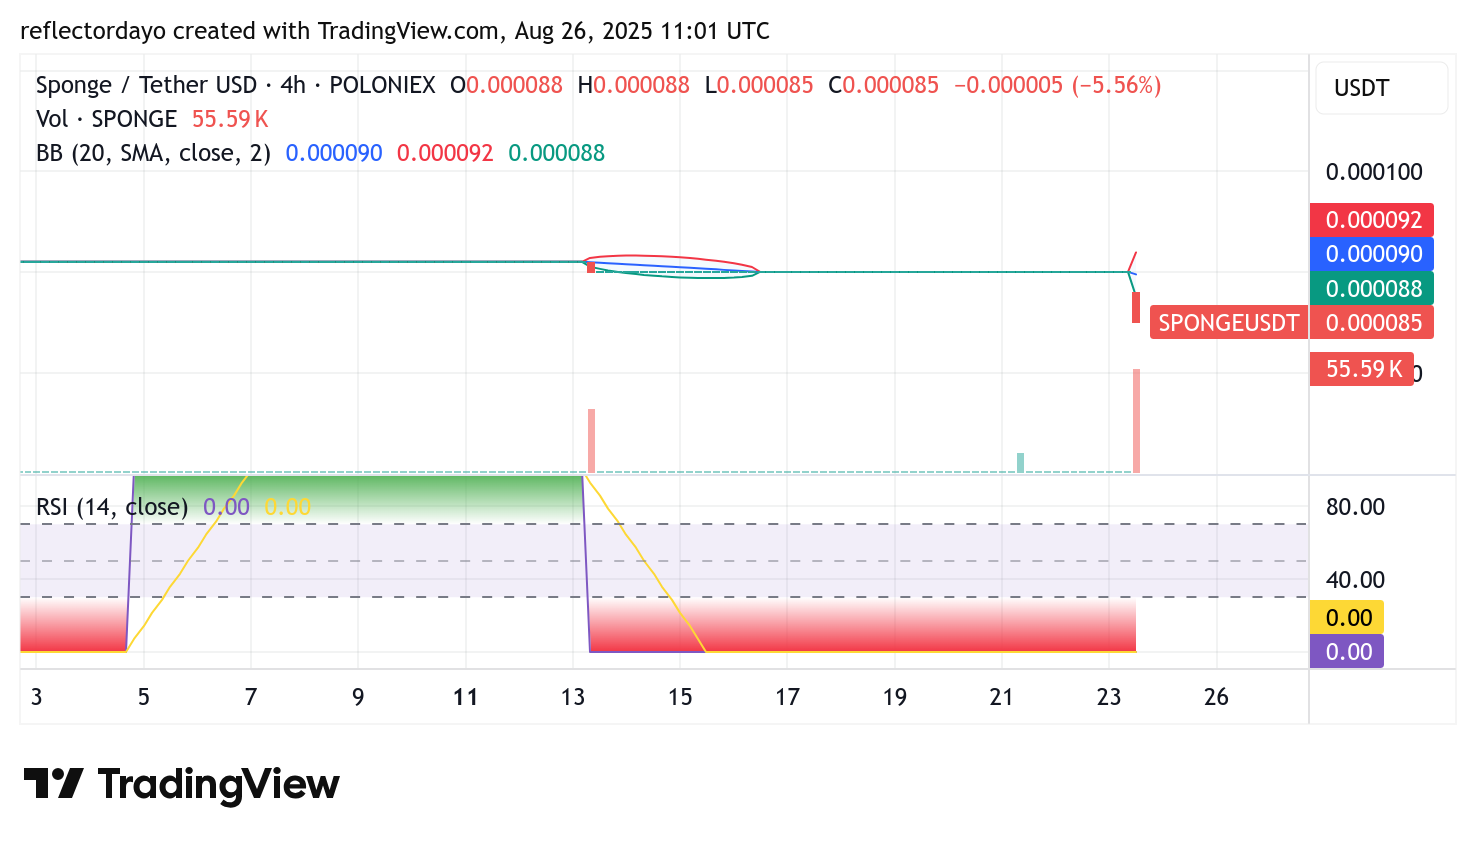
$SPONGE 4-Hour Chart: Heavy Volume Could Spark Buying Momentum
On the 4-hour chart, the market has recorded a surge in trading volume, largely triggered by the recent breakdown under $0.00009. Such spikes in activity often signal a shift in momentum, and if demand begins to absorb the excess supply, a recovery rally could lift SPONGE/USD back above the $0.00009 threshold, restoring bullish sentiment in the near term.
Buy SPONGE/USD!
LOADING ⚡️⚡️⚡️ pic.twitter.com/DrMAEfgCM3
— $SPONGE (@spongeoneth) August 23, 2025
Join the SPONGE community and get in on the next big crypto opportunity! Buy Sponge ($SPONGE) today