SPONGE/USD ($SPONGE): Potential Breakout Scenario Analysis
Estimated Reading Time: 2 minutes
Don’t invest unless you’re prepared to lose all the money you invest. This is a high-risk investment and you are unlikely to be protected if something goes wrong. Take 2 minutes to learn more

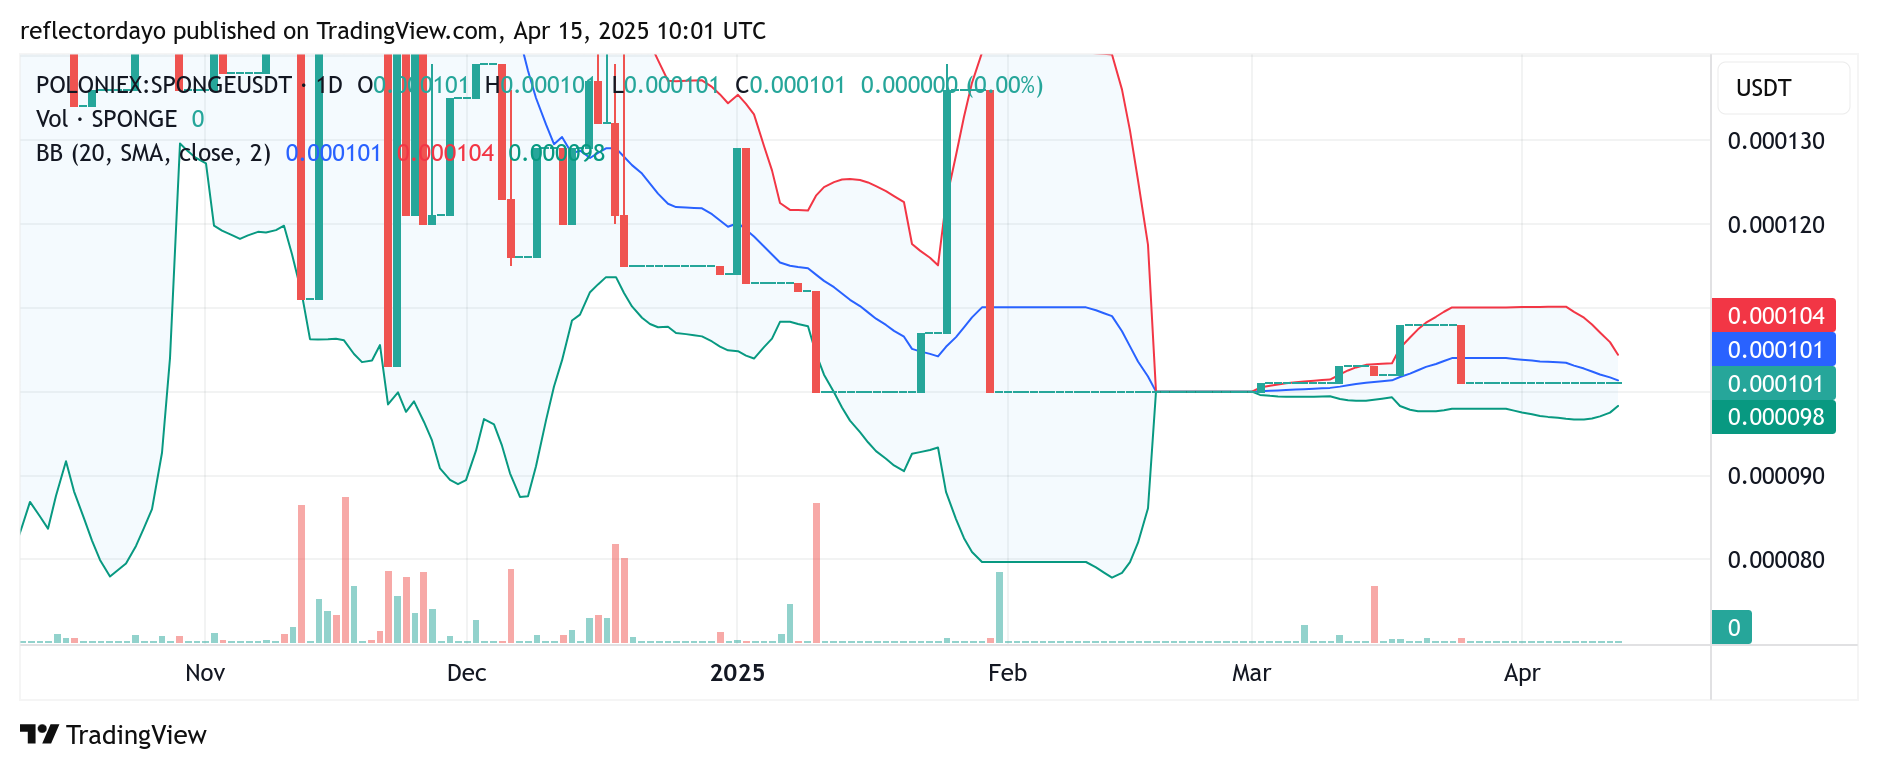
The daily chart of $SPONGE exhibits characteristics indicative of a potential near-term breakout. The 20-day moving average is converging with the current price level, which is consolidating around $0.0001. This convergence suggests increasing pressure and the potential for a directional price movement.
Technical indicators are showing signs of bullish alignment, supporting the possibility of an upward price trajectory.
Key Technical Levels:
- Resistance: $0.000110, $0.000120, $0.000130
- Support: $0.000090, $0.000085, $0.000080
Technical Assessment: Volatility Compression and Potential Bullish Reversal
Bollinger Bands are displaying a narrowing pattern, coinciding with the 20-day moving average’s approach to the $0.0001 price level. This compression typically signals a reduction in volatility and a potential shift in the crypto market momentum.
The current consolidation at $0.0001, following a previous downtrend, increases the probability of a bullish reversal. The established support at this level mitigates the risk of a significant bearish breakdown, suggesting a likely upward price reaction.
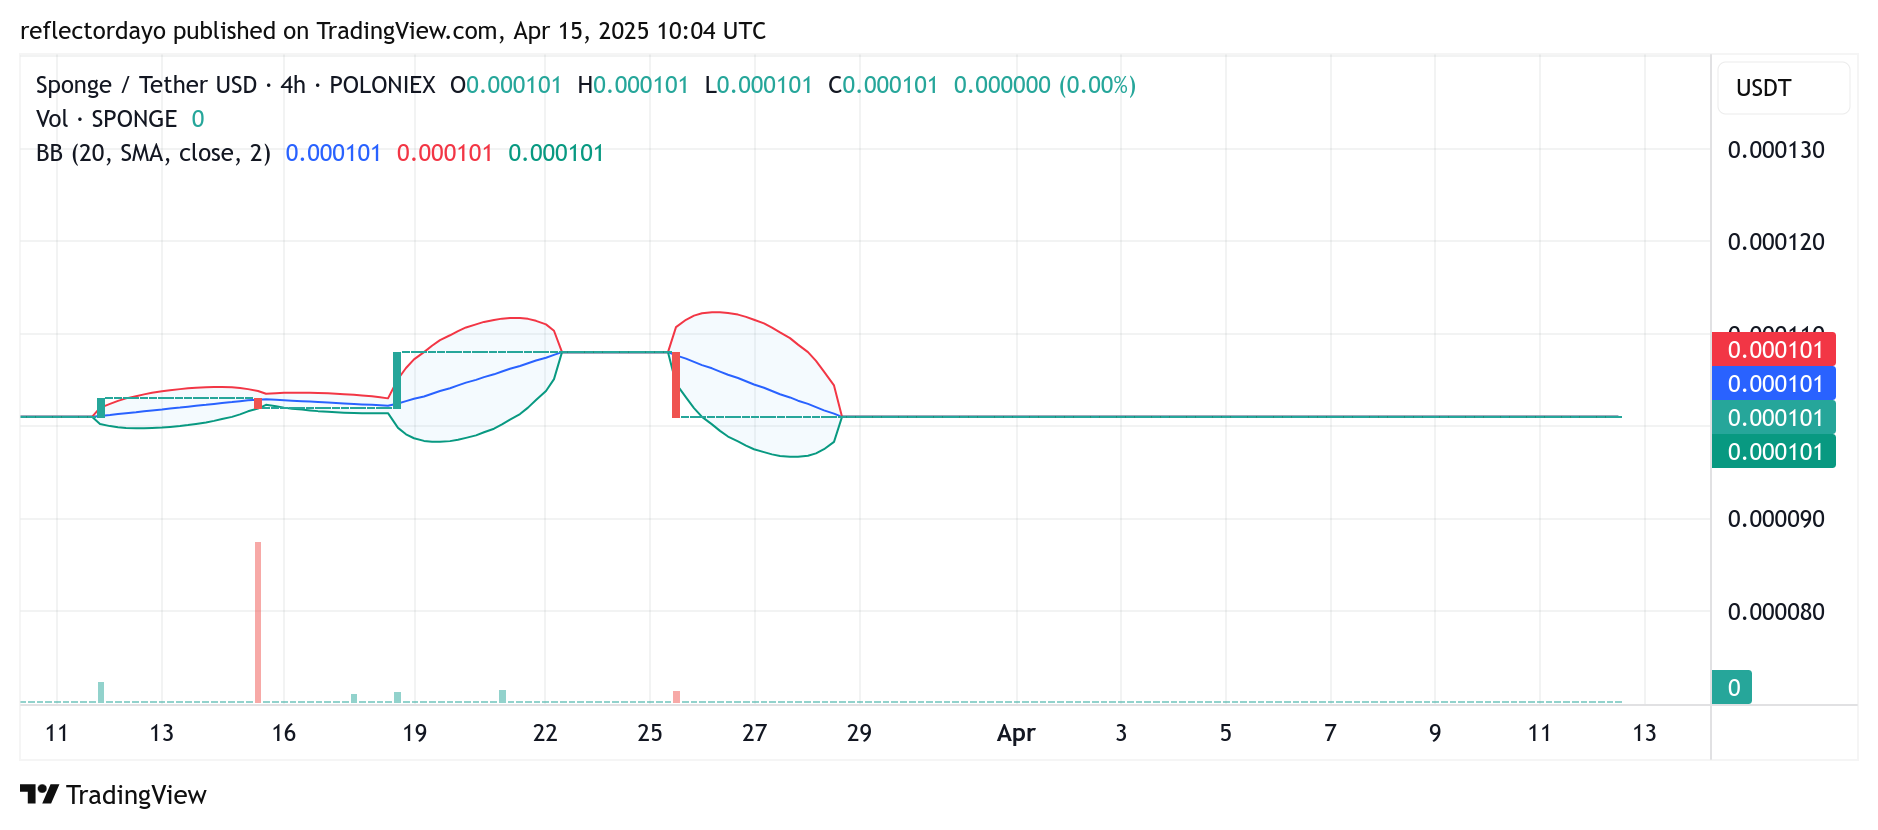
Short-Term Outlook: Breakout Potential Amidst Consolidation
The current $SPONGE market conditions present a potential buying opportunity, given the established price support and the low probability of a further decline below the present level. The prolonged consolidation phase indicates possible investor accumulation in anticipation of a bullish breakout.
A market rebound from the current level is expected to target a breach of the $0.000108 resistance, with a subsequent target of $0.00011.