SPONGE/USD ($SPONGE) Seeks Bullish Support Above $0.0015
Estimated Reading Time: 2 minutes
Don’t invest unless you’re prepared to lose all the money you invest. This is a high-risk investment and you are unlikely to be protected if something goes wrong. Take 2 minutes to learn more
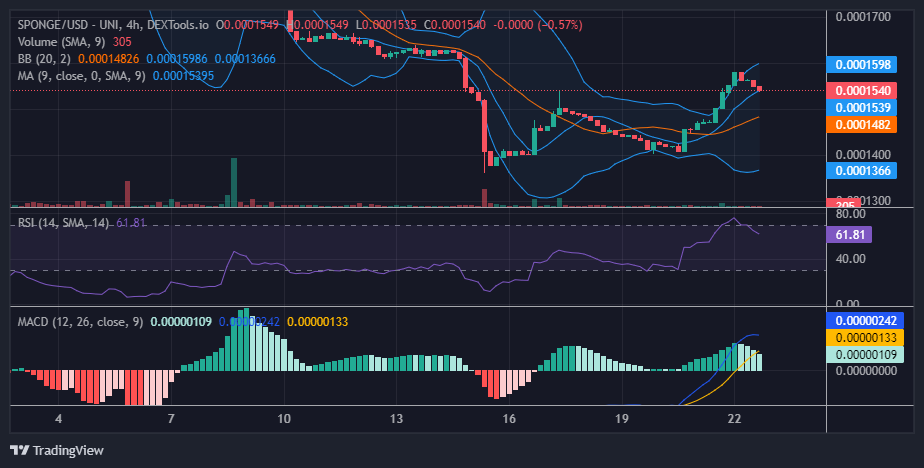
SPONGE/USD has successfully broken the resistance at the $0.00015 price level, briefly stopping at $0.000158. Currently, there is a brief price retracement in the market to encourage new bulls to come on board. The bullish force behind the market is high; therefore, bulls seek a higher support level at the $0.000154 price level.
Key Levels
- Resistance: $0.0004, $0.0045, and $0.0005.
- Support: $0.00015, $0.00014, and $0.00013.
Sponge (SPONGE/USD) Price Analysis: The Indicators’ Point of View
The SPONGE/USD bulls were so aggressive that within a short while, the market launched into the overbought region of the Relative Strength Index. This prompted some investors to take their profits, so the bullish momentum fell to 61.81 in the Relative Strength Index (RSI).
The market still maintains a strong buy sentiment, but the next thing for the bulls is to secure a support level at the current price level. The next stop for the market might be the $0.00017 price level.
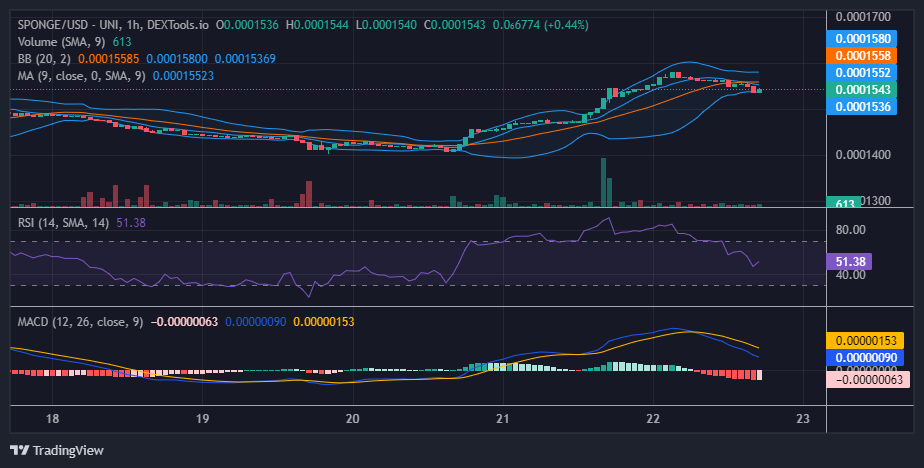
Sponge Short-Term Outlook: 1-Hour Chart
From this timeframe, we are able to see the tug-of-war in the market around the $0.0001558 price level. The struggle appears to be reaching its climax. We are about to see another bullish breakout. Although in the Bollinger Bands and the Relative Strength Indicator (RSI), the market seeks solid ground in the bearish zone, in the Moving Average Convergence and Divergence (MACD) indicator, the lines are still far above the negative level.
Join the Sponge airdrop now.
🌊 Calling all #SPONGERS! 🗣️
🧽 Have you joined the $SPONGE #Airdrop yet?! 🚀🎁
🌊 Make sure you meet the designated requirements on our #Discord server to be eligible!✅
🧽 Discover all the guidelines in the airdrop-signup section!📝💰
🔗 https://t.co/LaiRot6tLJ pic.twitter.com/ap4CBI4gks
— $SPONGE (@spongeoneth) June 22, 2023
Invest in the hottest and best meme coin. Buy Sponge ($SPONGE) today!