SPONGE/USD ($SPONGE) Still Anticipates a Bounce at $0.000096
Estimated Reading Time: 3 minutes
Don’t invest unless you’re prepared to lose all the money you invest. This is a high-risk investment and you are unlikely to be protected if something goes wrong. Take 2 minutes to learn more
In our prior SPONGE/USD market analysis, we maintained an optimistic perspective regarding the prospects for sustained upward momentum. Based on historical data and market trends, there was a prevailing expectation of a price rally, particularly as the market had reached a historically significant bullish support level.
Regrettably, the market did not align with this expectation, as bullish forces proved insufficient to propel prices upward. Consequently, bearish sentiment gained strength, prompting buyers to adapt by adjusting their positioning slightly. Currently, they are regrouping and consolidating around the $0.000094 support level. This adjustment reflects the evolving dynamics within the market.
Key Levels
- Resistance: $0.000115, $0.000120, and $0.000125.
- Support: $0.000090, $0.000080, and $0.000085.
Sponge (SPONGE/USD) Price Analysis: Insights from Technical Indicators
In today’s SPONGE/USD market, persistent selling pressure has been evident, although the bullish presence remains intact around the support level, albeit with some degree of adjustment. Historically, this support level has proven to be a pivotal starting point for bullish cycles, a trend that has persisted since early September. This historical pattern bolsters the belief in the potential for a market rally to initiate at this price level.
Furthermore, the Relative Strength Index (RSI) not only signals an oversold condition but also indicates that the market is currently within the oversold region. This underscores the prevailing extreme bearish sentiment in the market. This oversold condition hints at the possibility of a price correction and aligns with the expectation of a resurgence in bullish sentiment, particularly in the vicinity of the critical $0.000096 price level.
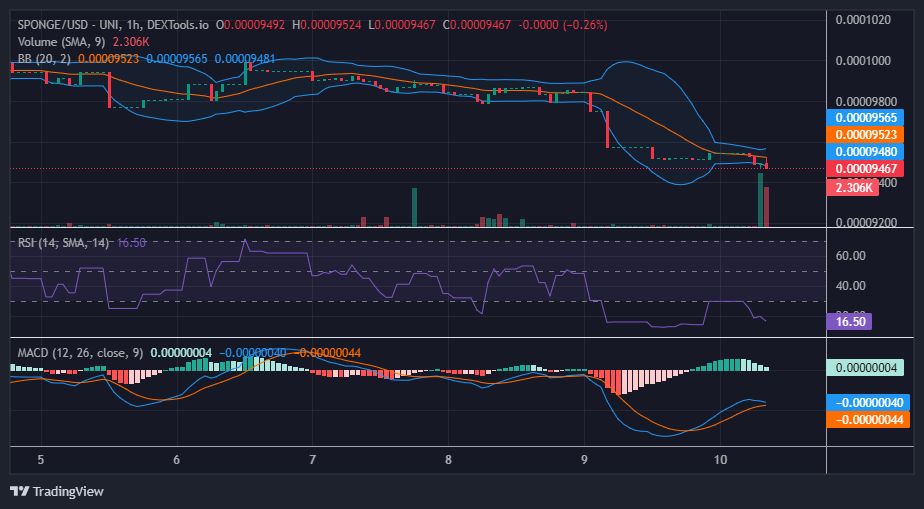
$SPONGE Short-Term Outlook: 1-Hour Chart
Upon analysis of the 1-hour chart, it’s evident that the Bollinger Bands indicator is undergoing convergence, resulting in the formation of a narrowing price channel. This phenomenon typically signifies a volatility squeeze, often preceding a substantial market movement.
Furthermore, over the past two 1-hour sessions, we’ve observed notably tall histograms within the volume of trade indicator. This observation points to a heightened level of demand and supply activity in the market. However, it’s worth noting that the candlestick patterns themselves do not exhibit significant variations.
Taken together, this particular market behavior can be interpreted as a consolidation phase, potentially serving as a precursor to a forthcoming bullish trend.
As Season 1 of Airdrop wraps down in November, catch the $SPONGE buzz!
Catch the $SPONGE hype as #Airdrop Season 1 winds down in November! 🚀🌊
Don’t let this chance slip away! 🎉💸
Join now, #Hodl and trade to boost your points! 📢🧽
🔗https://t.co/lzRhjW4oLL pic.twitter.com/jFsbsphSiF
— $SPONGE (@spongeoneth) October 10, 2023
Invest in the hottest and best meme coin. Buy Sponge ($SPONGE) today!