Stacks (STX/USD): Bulls Charge Back, Eyeing Higher Ground
Estimated Reading Time: 2 minutes
Don’t invest unless you’re prepared to lose all the money you invest. This is a high-risk investment and you are unlikely to be protected if something goes wrong. Take 2 minutes to learn more
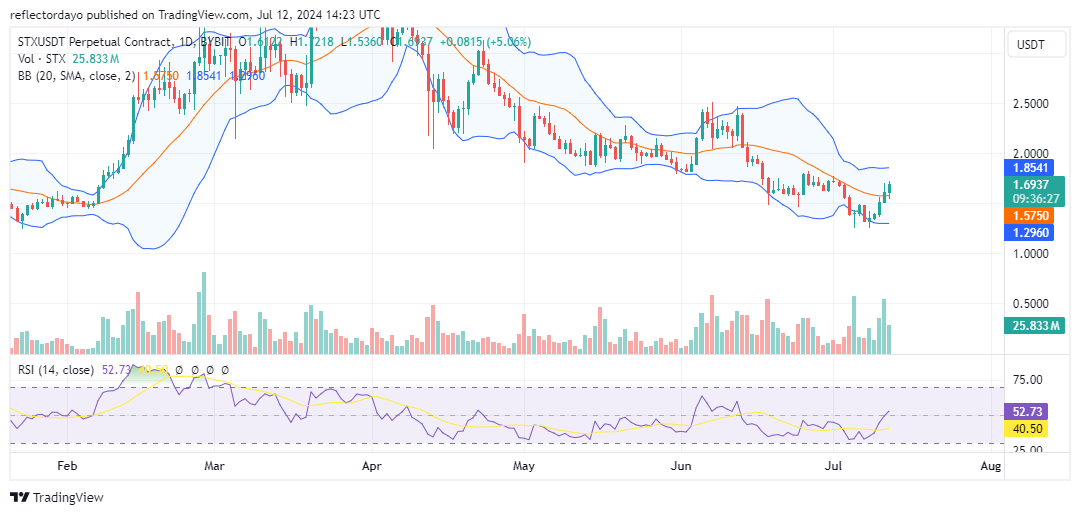
Tracing the Stacks market trend since April, we observe a long-term decline following the high of $3.80. During the bear market, support emerged as bulls gathered around the $2.00 level. This crypto signal led to a period of consolidation lasting into mid-June. However, by the second half of June, selling pressure intensified, causing the market to settle below the $1.50 level.
The Stacks Market Data
- STX/USD Price Now: $1.68
- STX/USD Market Cap: $2 billion
- STX/USD Circulating Supply: 1.5 billion STX
- STX/USD Total Supply: 1.8 billion STX
- STX/USD CoinMarketCap Ranking: #31
Key Levels
- Resistance: $2.00, $2.30, and $2.50
- Support: $1.30, $1.20, and $1.00.
The Stacks Market Through the Lens of Indicators
An attempt to push the market above the $2.50 price level failed, leading to a decline and causing the market to settle at the $1.50 level. Initially, the bull market experienced high volatility and encountered strong bearish resistance at $2.50, resulting in a significant downturn. Although volatility has decreased recently, aggressive bullish activity has driven the market upward, causing a slight increase in volatility. The Bollinger Bands, which previously indicated a bearish market, are now reflecting horizontal price consolidation. A crucial test for bullish momentum is breaking above the $1.74 resistance level. If the Stacks market fails to break through this level, it may continue to consolidate around the $1.50 price level.
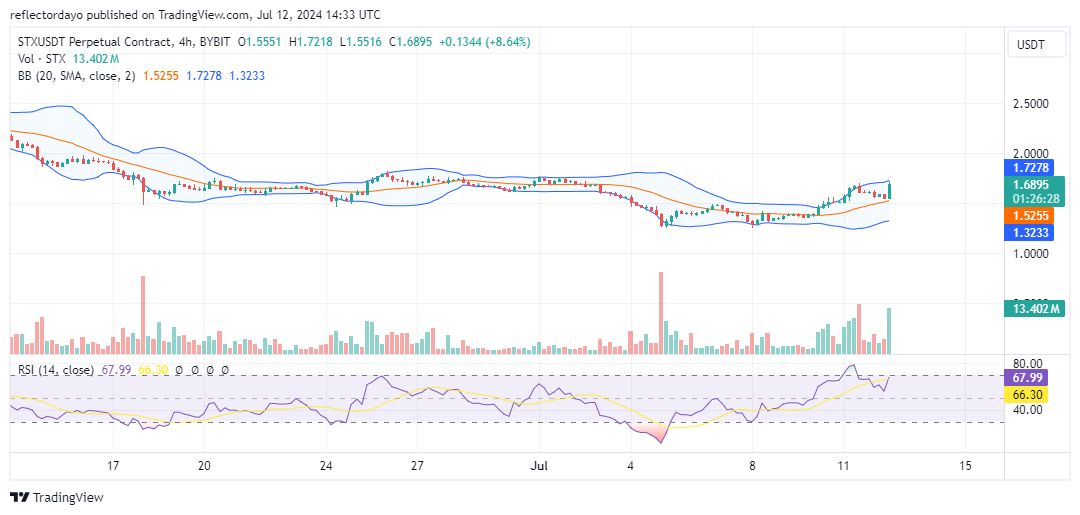
STX/USD Price Prediction: 4-Hour Chart Analysis
In the current 4-hour session, the market has gained significant bullish momentum. The volume indicator shows a trading rush, evident from the substantial histogram. However, as soon as the price action reached the $1.74 level, a significant bearish resistance level, substantial profit-taking has pegged the progress of the bullish candlestick near $1.74. Traders should watch for a breakout at this level, as it will confirm the bullish trend. Conversely, a breakdown will indicate the continuation of the consolidation trend.