Livepeer (LPT/USD) Shoots for $20 After Breaking Downtrend
Estimated Reading Time: 3 minutes
Don’t invest unless you’re prepared to lose all the money you invest. This is a high-risk investment and you are unlikely to be protected if something goes wrong. Take 2 minutes to learn more
The bear market has brought the Livepeer market back to the $12.00 price level, where the last bullish trend began in early May. Consequently, the current price action bounce and recovery have a favorable prospect of reaching substantial price levels. However, to confidently predict the outcome of the Livepeer market dynamics, it is essential to consider historical data, market behavior, and signals from crypto indicators. These factors can provide insights into the potential direction of the market.
Livepeer Market Data
- LPT/USD Price Now: $14.42
- LPT/USD Market Cap: $471 million
- LPT/USD Circulating Supply: 33 million
- LPT/USD Total Supply: 33 million
- LPT/USD CoinMarketCap Ranking: #120
Key Levels
- Resistance: $16.00, $16.50, and $17.00
- Support: $12.00, $11.50, and $11.00.
Livepeer Through the Lens of Indicators
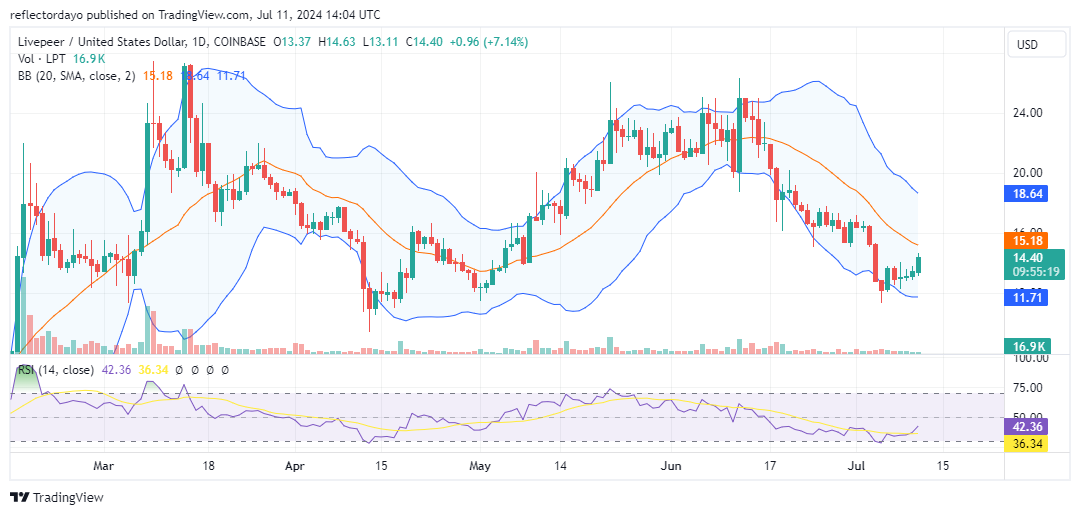
After the bull run began in early May, the price action settled between the $20.00 and $24.00 levels, ranging sideways within this horizontal price channel for a while before experiencing another shift. During this consolidation phase, the bulls aimed to push the price to $26.00 but were unable to maintain momentum and failed to establish the $24.00 level as a support. This failure initiated the start of the bear market, which now appears to be ending at the $12.00 level.
Considering the indicators: Although the current price action shows a strong recovery in the bull market, the indicators still reflect a bearish outlook. The RSI line remains below 50, indicating the market is still in the sell zone, and the price action is below the 20-day moving average, though it is expected to catch up soon. The Bollinger Bands continue to show a downward-moving price channel. Additionally, the volume of trade indicator shows very low histograms, undermining the credibility of the ongoing price rally and suggesting that the rally dynamics may not be sustainable. However, the significant bull market could be driven by large investors accumulating the asset to boost its value. Further examination of the market is needed to provide more insights.
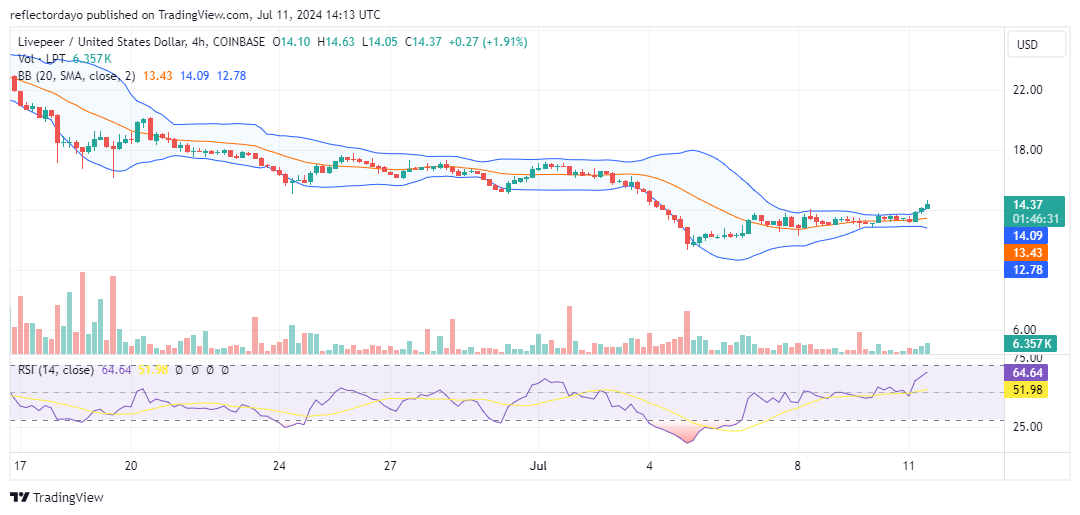
LPT/USD Price Prediction: 4-Hour Chart Analysis
The intervention of major players in the bull market can significantly influence other traders to join the trend and buy, which in turn should increase trading volume. This appears to be the case here. When viewing the market from a 4-hour chart perspective, the volume of trade indicator shows histograms with greater heights, reflecting increased buying activity. This bullish sentiment observed in the 4-hour chart may soon extend its influence to the daily chart.
However, traders should be aware that the market is already encountering resistance above the $14 price level. The upper shadow on the latest candlestick on the chart indicates this resistance.