Starknet (STRK/USD) Poised for a Potential Bounce
Estimated Reading Time: 2 minutes
Don’t invest unless you’re prepared to lose all the money you invest. This is a high-risk investment and you are unlikely to be protected if something goes wrong. Take 2 minutes to learn more

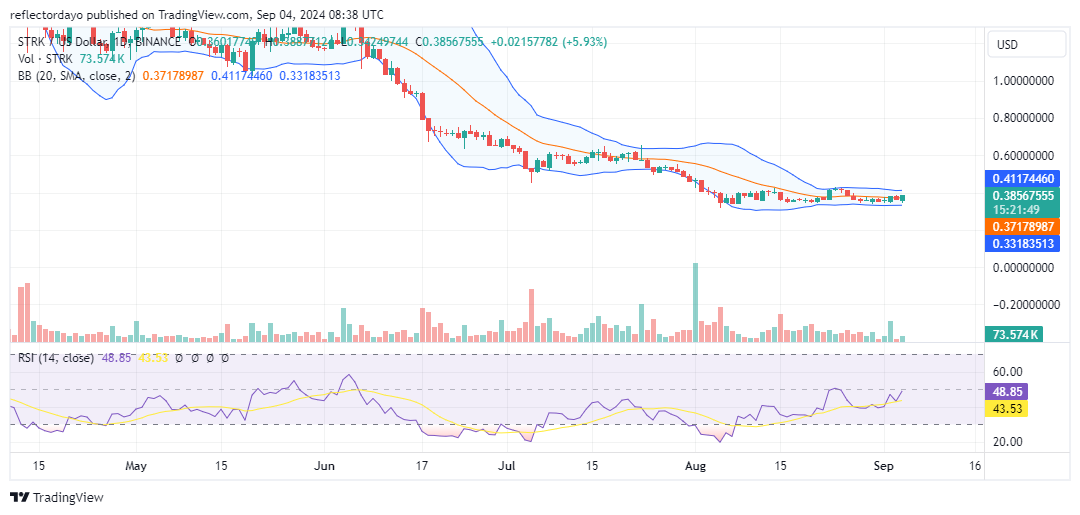
The Starknet market launched in February, and as the chart illustrates, initial speculation was substantial. On February 20, the market reached a peak above the $7.20 price level. However, this has been the highest point since then. The daily chart shows a consistent downward trend, with the market breaking into increasingly lower price territories.
After a prolonged period, the market is approaching the $0.20 price threshold, the original starting point in February. This proximity suggests that a renewed bullish sentiment and upward price movement may be imminent.
Starknet Market Data
- STRK/USD Price Now: $0.386
- STRK/USD Market Cap: $681 million
- STRK/USD Circulating Supply: 1.8 billion STRK
- STRK/USD Total Supply: 10 billion STRK
- STRK/USD CoinMarketCap Ranking: #80
Key Levels
- Resistance: $0.45, $0.50, and $0.60
- Support: $0.35, $0.30 and $0.25.
The Starknet Market Through the Lens of Indicators
As the market approaches the $0.20 price level, the initial starting point of the uptrend, momentum is waning and price consolidation is evident, with sideways movement around the $0.38 price level. This crypto signal suggests a potential breakout.
To reinforce this expectation, the Bollinger Bands are converging, forming a narrow price channel that indicates declining volatility. Such market behavior often precedes significant price movements. Given the market’s proximity to the $0.20 price level, a critical support level and the origin of the previous bull market, a breakout may be a probable outcome.
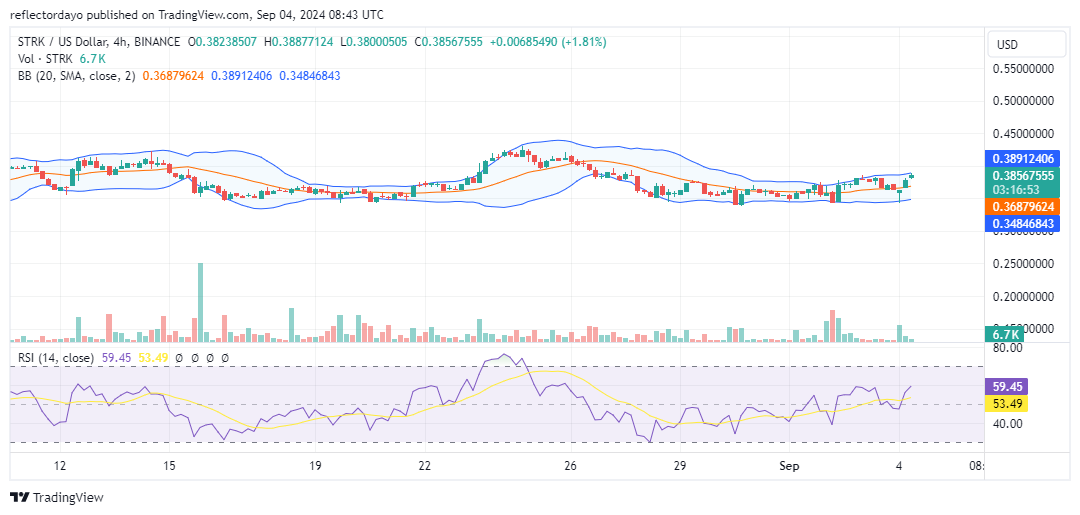
STRK/USD Price Prediction: 4-Hour Chart Analysis
Examining a shorter timeframe on the Starknet market, we observe low volatility, which could potentially hinder a breakout. As the chart indicates, the market is poised for a breakout. The price is trading above the 20-day moving average, but bulls face resistance near the $0.389 level.
Analyzing the trading volume, there are few signs of an imminent breakout due to inconsistent and low volume bars. Nevertheless, the market remains primed for a rebound and a potential breakout. We may soon witness a significant upward movement.