Superverse (SUPER/USD) Forms Pivotal Support, Bullish Recovery in Progress
Estimated Reading Time: 3 minutes
Don’t invest unless you’re prepared to lose all the money you invest. This is a high-risk investment and you are unlikely to be protected if something goes wrong. Take 2 minutes to learn more

October has been a notably volatile month for the Superverse (SUPER/USD) market, with price movements largely dominated by downward pressure. Initially, demand and supply clashed above the $0.60 price level, but once the bears gained the upper hand and breached this key support, bearish momentum intensified, driving the market lower.
The decline eventually bottomed out around the $0.40 level, where buying interest began to resurface. Since then, bullish traders have been gradually regaining control, although they continue to face resistance from lingering bearish sentiment in the market. The $0.40 zone now serves as a pivotal support level, providing a possible foundation for a sustained bullish recovery if momentum continues to build.
Superverse (SUPER/USD) Market Data
- SUPER/USD Price Now: $0.48
- SUPER/USD Market Cap: $282.7 million
- SUPER/USD Circulating Supply: 628 million SUPER
- SUPER/USD Total Supply: 999.99 million SUPER
- SUPER/USD CoinMarketCap Ranking: #160
Key Levels to Watch
- Resistance: $0.50, $0.60, $0.70
- Support: $0.40, $0.30, $0.20
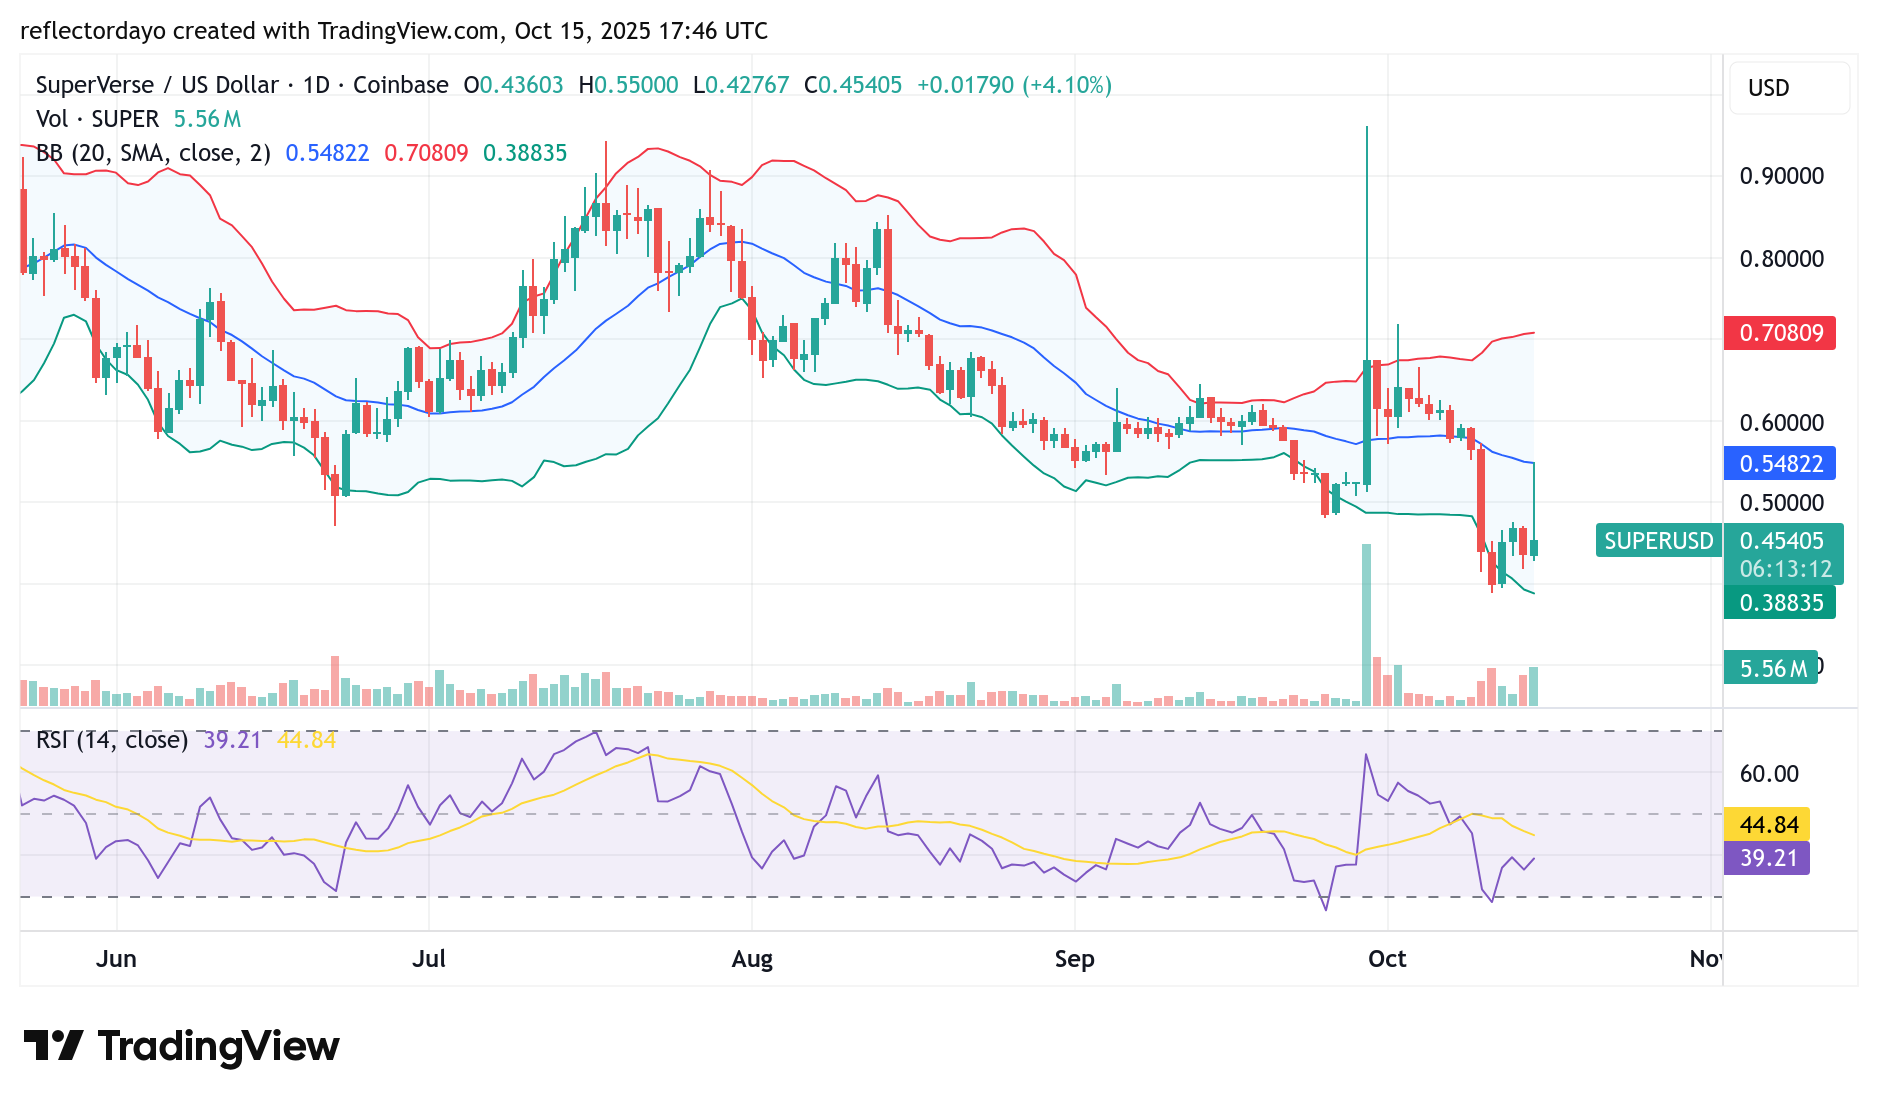
Superverse Market (SUPER/USD) Daily Chart Outlook
The bullish recovery in the Superverse market remains in progress, although bulls still face residual bearish momentum. Sellers have established a strong resistance zone around the $0.47 price level, creating a temporary equilibrium between buying and selling pressures.
The Bollinger Bands continue to indicate heightened volatility, suggesting that traders are actively responding to short-term market fluctuations. Bulls briefly capitalized on this volatility, driving prices up to the $0.54 level—which aligns with the 20-day moving average—but they were unable to sustain the rally. As a result, the market retraced below the $0.47 resistance level.
This pullback highlights that volatility remains a dominant feature of the market. Therefore, further erratic price movements may occur in the near term. Nonetheless, the $0.40 price level continues to serve as a crucial support zone, given its previous pivotal bounce, and could once again provide a strong foundation for bullish recovery if tested.
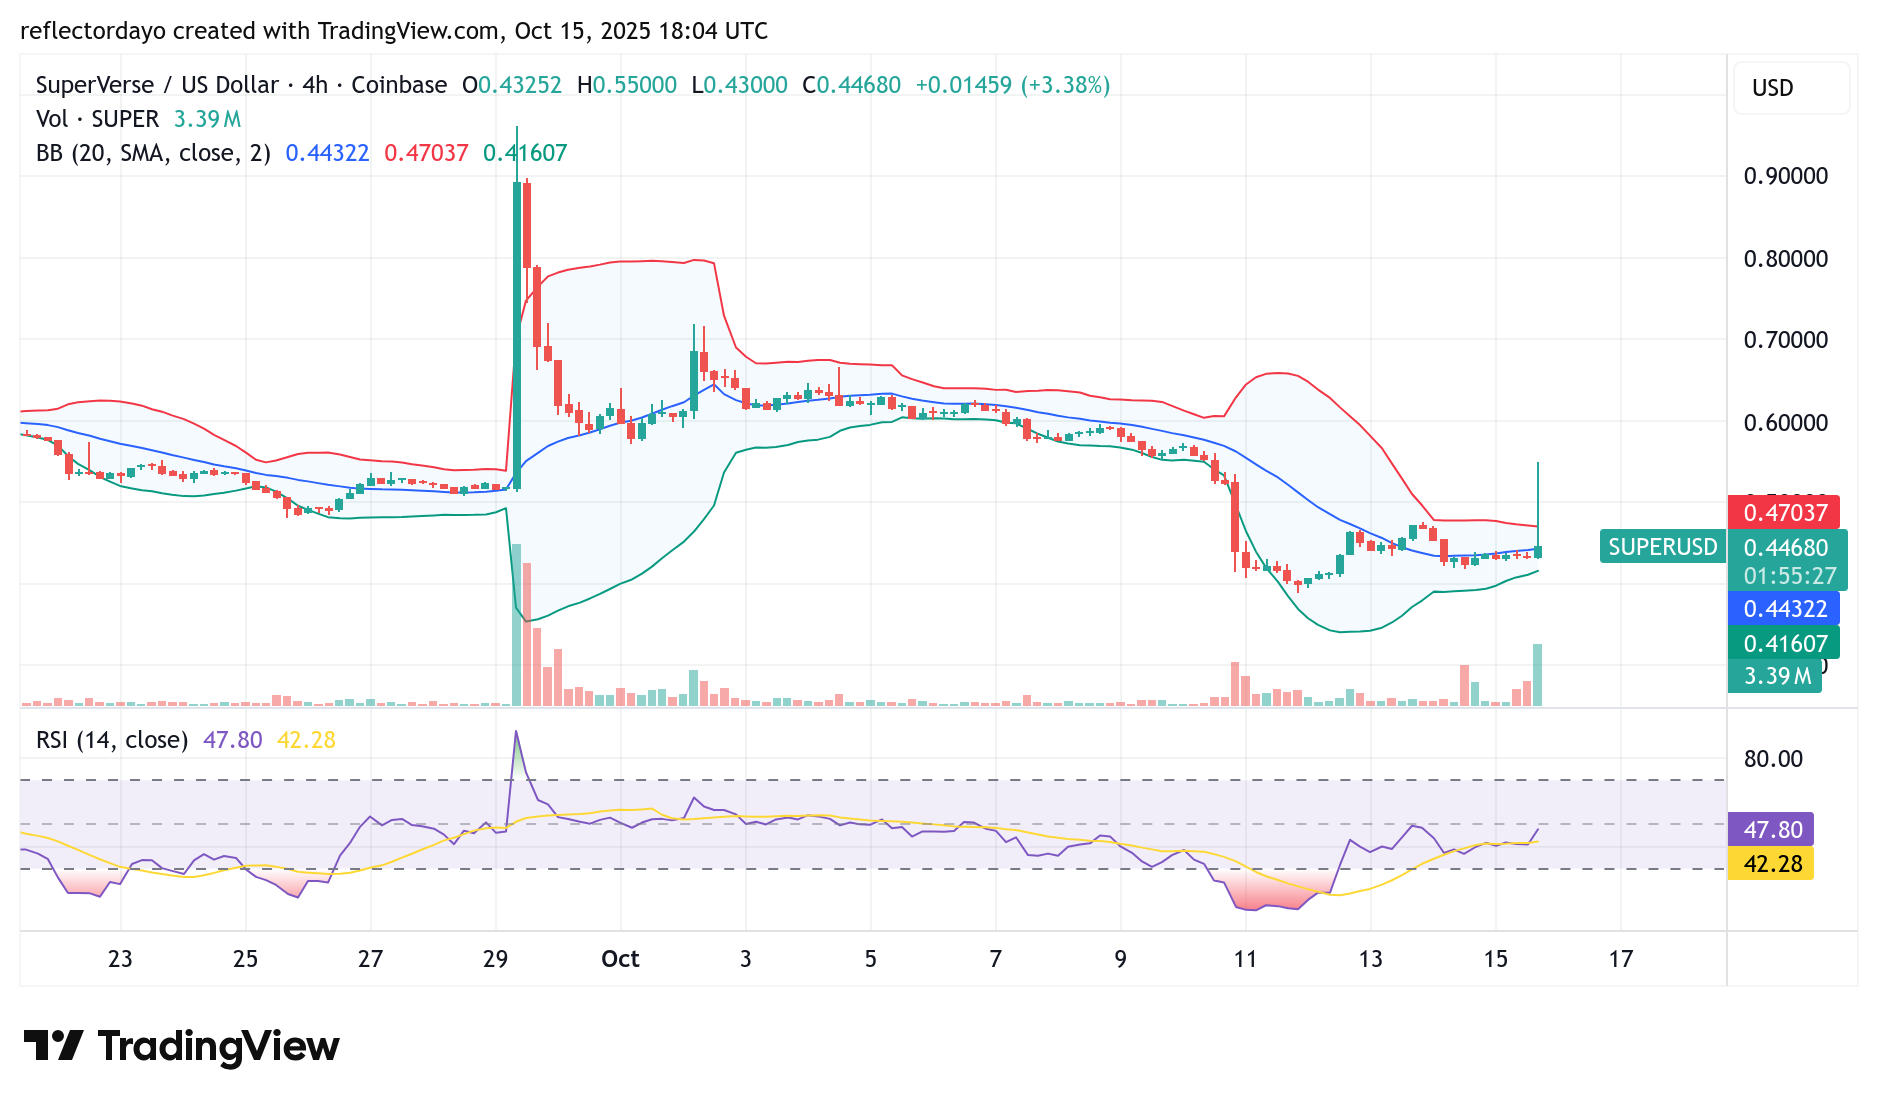
SUPER/USD 4-Hour Chart Outlook
The price currently holds steady around the $0.43 level, aligning closely with the 20-day moving average, indicating a state of equilibrium. From the 4-hour perspective, market activity has remained relatively still since the morning sessions. However, in the ongoing 4-hour trading session, a sudden upward breakout has occurred, as reflected by a sharp increase in the trading volume histogram.
This surge signals a renewed wave of investor interest, with the bulls appearing to maintain control as the price now stands at $0.45. Nonetheless, this bullish momentum may soon fade, suggesting the possibility of the price returning to its previous consolidation range.