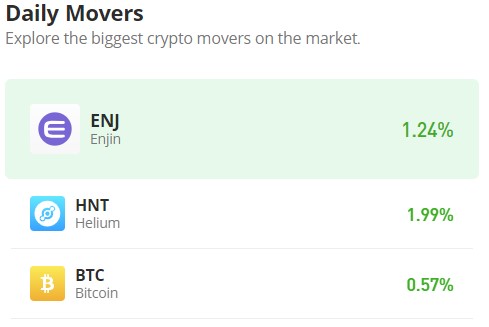
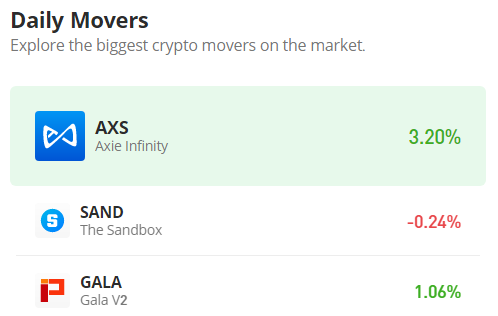
Axie Infinity’s (AXS/USD) Bullish Bias Grows Stronger as the Market Approaches the $6.00 Mark
Estimated Reading Time: 3 minutes
Don’t invest unless you’re prepared to lose all the money you invest. This is a high-risk investment and you are unlikely to be protected if something goes wrong. Take 2 minutes to learn more
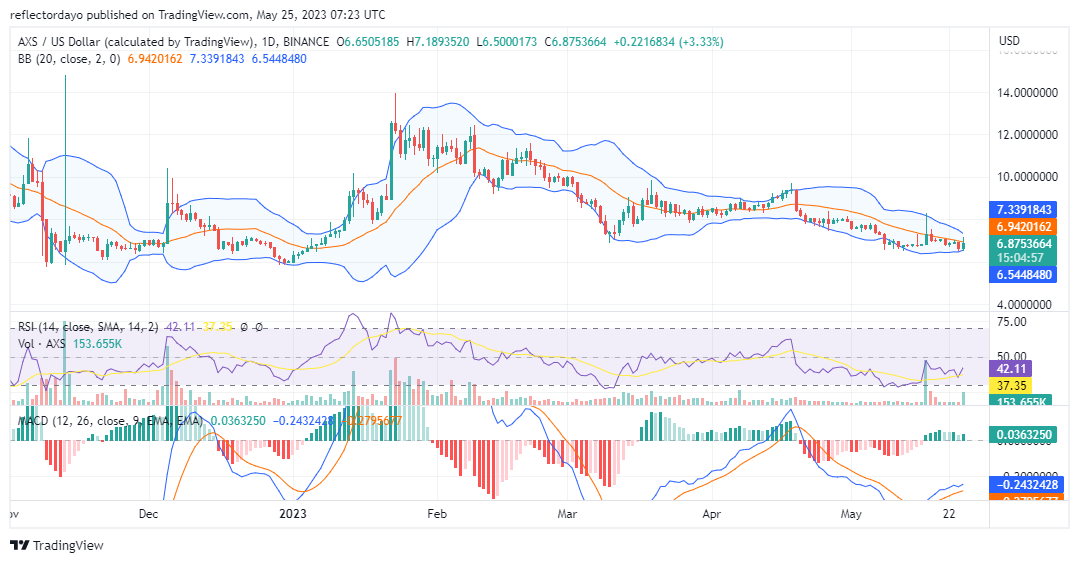
Axie Infinity has not seen a significant bull market after the January uptrend peaked at the year’s high of $14.00. Since the early-year high, the market has been seeing lower highs. However, between March and April, bulls became strong enough to send the market into a sideways range. The price action oscillated around the $8.44 price level. But towards the end of April and early part of May, the market settled into the $6.00 and $8.00 price zones.
AXS Market Data
- AXS/USD Price Now: $6.89
- AXS/USD Market Cap: $805,302,270
- AXS/USD Circulating Supply: 116,950,495 AXS
- AXS/USD Total Supply: 270,000,000
- AXS/USD Coinmarketcap Ranking: #56
Key Levels
- Resistance: $9.00, $10.00, and $11.00
- Support: $6.00, $5.00, and $4.50
Price Prediction for Axie Infinity: The Market May Bounce Back at the $6.00 Price Level (The Indicators’ Point of View)
The Bollinger Bands indicator illustrated the Axie Infinity market’s downtrend since its peak in late January. Along the line, there were a number of bullish attempts to rally back to the $14.00 price level. Bulls still have that price mark in view, but their recovery attempts only result in the formation of lower highs. These lower highs provided the AXS/USD sellers with a strong base for more bearish conquests. The downtrend finally hit a formidable barrier at the $6.5 price mark, and since then, the market has consolidated along this same level. However, in the cause of the sideways market, we notice a few bullish spikes, which show that bulls are gathering momentum at this level even though bears are still stronger. Today’s trading session is also being dominated by the AXS buyers, which is why we see the Bollinger Bands contracting. The indicator’s contraction is a sign that bulls are catching up with bears.
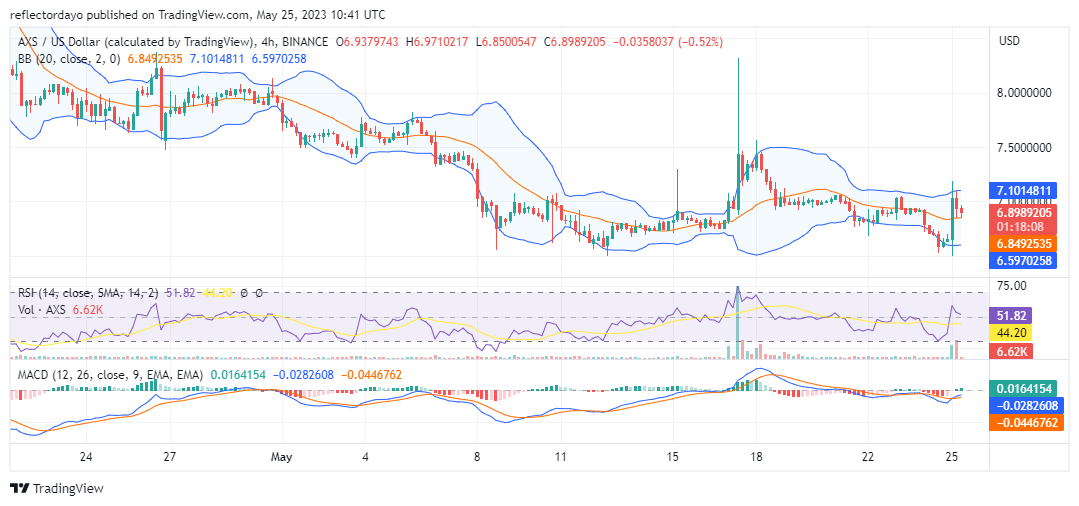
AXS/USD 4-Hour Chart Outlook: The Market Is Back at the Midrange
From this point of view, it appears like bulls are not strong enough to sustain the bullish recovery, but they are holding firm to the $6.00 price mark. The first four hours of today’s trading session were dominated by the bulls. They pushed the market above the 20-day moving average and reached the $7.2 price level before traders (long-term holders) began to take their profits. This sent the market back to equilibrium. A new support level should form at $6.8, and this should form the basis for more bullish action.