SushiSwap (SUSHIUSD) Finds a Clear Direction
Estimated Reading Time: 2 minutes
Don’t invest unless you’re prepared to lose all the money you invest. This is a high-risk investment and you are unlikely to be protected if something goes wrong. Take 2 minutes to learn more
The SushiSwap market began its upside journey in June after strong selling pressure forced the price to fall below the key support level for the year. Before the recovery from the year’s low, the SushiSwap market had been consolidating along the support level, with bulls barely holding on to the key demand level. But at the low of $0.4752, the bull market finds solid ground to turn the market in an upward direction.
SushiSwap Market Data
- SUSHI/USD Price Now: $0.8041
- SUSHI/USD Market Cap: $184,739,086
- SUSHI/USD Circulating Supply: 230,785,414 SUSHI
- SUSHI/USD Total Supply: 249,349,281
- SUSHI/USD CoinMarketCap Ranking: #148
Key Levels
- Resistance: $1.00, $1.20, and $1.50.
- Support: $0.60, $0.55, and $0.50.
Price Prediction for SushiSwap: The Indicators’ Point of View
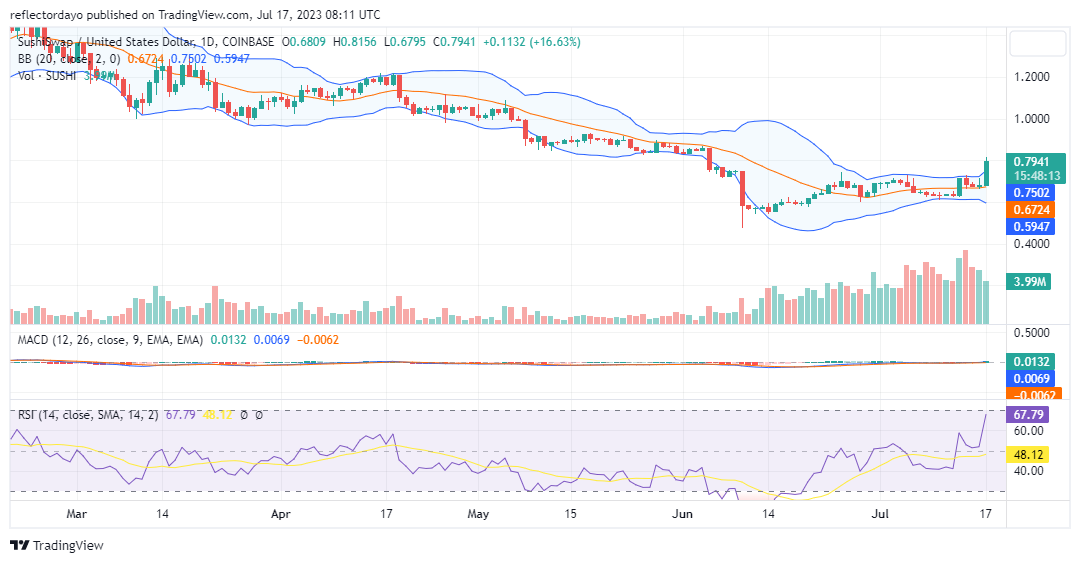
The SushiSwap market has fallen deeper below the key support level, and its bullish recovery is still below the year’s crucial support level of $0.914. Between late June and early July, the market oscillated between the horizontally moving price channels of $0.600 and $0.7244 before the strong price breakout.
So far in today’s market, we have noticed a very strong bullish candlestick, representing a 16.53% gain. As illustrated by the Bollinger Bands indicator, the market has broken out of indecision. However, traders need to wait for more confirmation to check if this is not a fakeout movement.
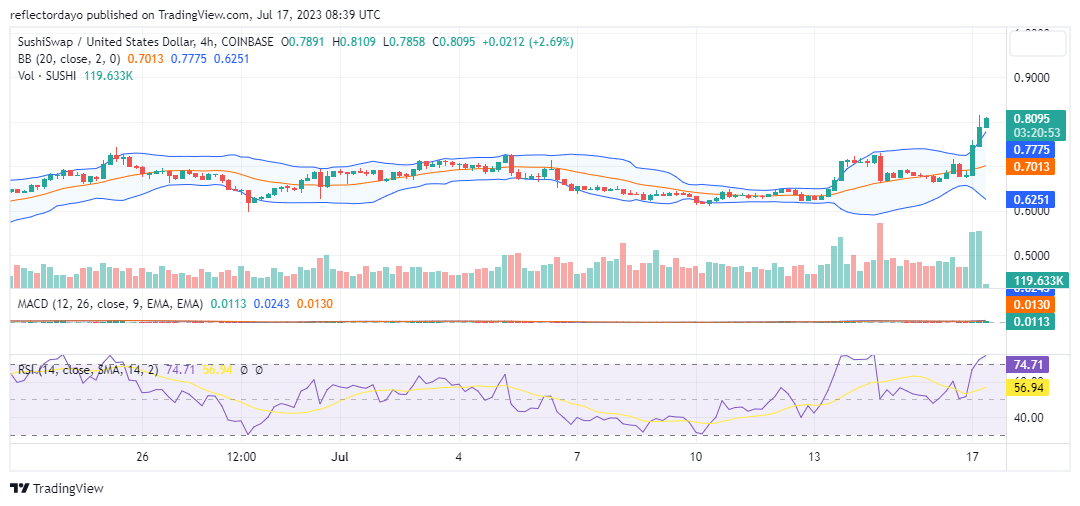
SUSHI/USD 4-Hour Chart Outlook
On a smaller timeframe, The Relative Strength Index (RSI) suggests a very strong bullish movement. Such a strong bull market like this can trigger a repressive bearish response, as the market ventured very quickly within a short while into overbought territory. The breakout suggests a significant shift in market sentiment and increased volatility. The divergence in Bollinger Bands indicates that the price has moved outside the normal range, potentially signaling strong momentum in the new direction.