Synthetix (SNX/USD) Rockets Higher: $2.5 Within Reach
Estimated Reading Time: 3 minutes
Don’t invest unless you’re prepared to lose all the money you invest. This is a high-risk investment and you are unlikely to be protected if something goes wrong. Take 2 minutes to learn more
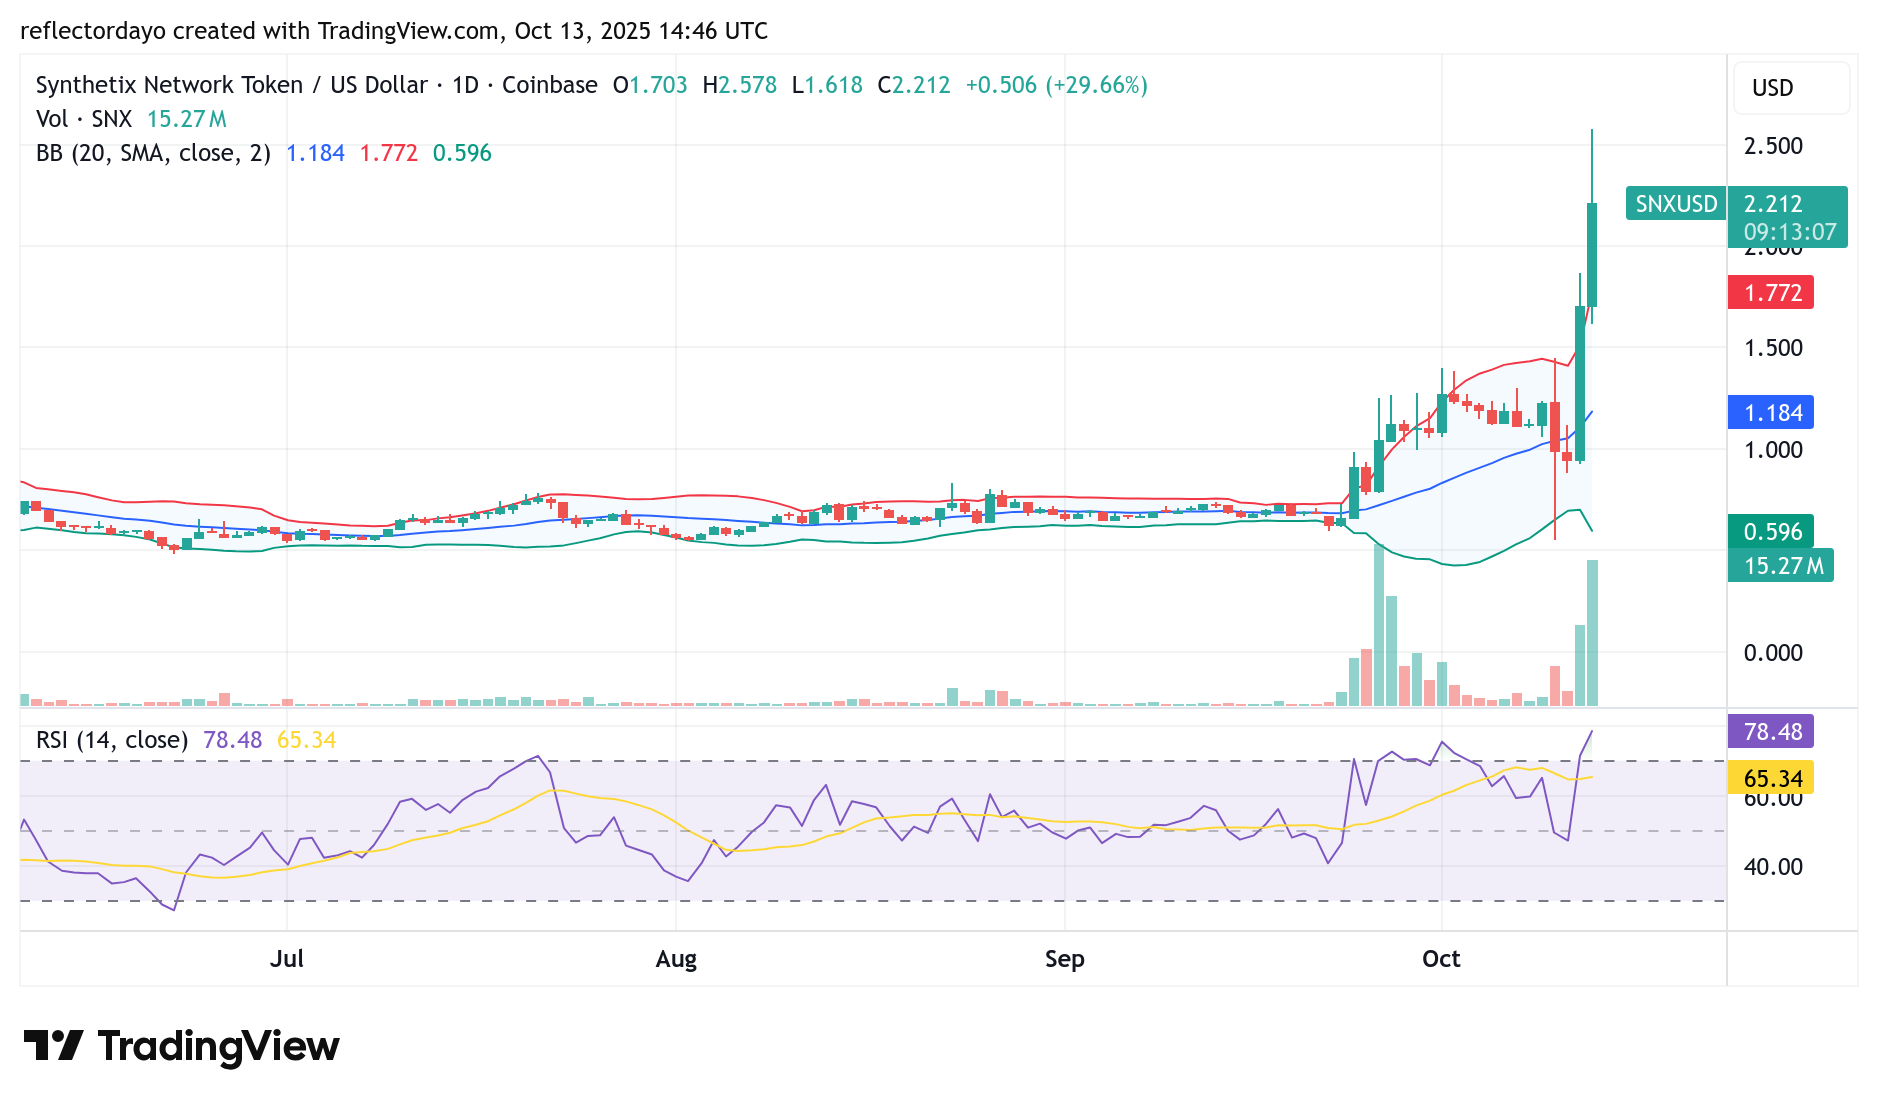
Between late last month and the beginning of this month, the crypto market has experienced notable volatility—and the Synthetix (SNX) market is no exception. During this period, SNX has shown a significant upward move, gaining strong momentum in the bullish direction.
In particular, between yesterday and today, the market witnessed a sharp escalation in price action as Synthetix broke through several key resistance levels. The $1.50 barrier was breached, followed by breakouts above the $1.85 and $2.00 resistance zones—all of which were crucial turning points in the recent trend.
This strong bullish performance suggests that the price surge may have been driven by a significant catalyst, possibly tied to recent developments or renewed investor sentiment around the Synthetix ecosystem.
Synthetix (SNX/USD) Market Data
- SNX/USD Price Now: $2.215
- SNX/USD Market Cap: $782 million
- SNX/USD Circulating Supply: 343.5 million SNX
- SNX/USD Total Supply: 339.9 million SNX
- SNX/USD CoinMarketCap Ranking: #86
Key Levels to Watch
- Resistance: $2.50 $3.00, $3.50
- Support: $1.50, $1.30, $1.20
Synthetix (SNX/USD) Daily Chart Outlook
The strong bullish performance observed in the last two trading sessions is particularly notable. While the exact catalyst behind this surge remains uncertain, it’s worth acknowledging that recent developments within the Synthetix ecosystem may have contributed to the current wave of buying activity.
However, despite this impressive upward momentum, the market’s sharp rise has introduced heightened volatility, suggesting that a short-term correction could soon unfold. The $2.50 price level appears to be encountering growing bearish resistance, as buying momentum begins to lose strength.
Should the market pull back, the $2.00 zone may serve as a potential reentry point for bullish traders—a critical pivot area that could provide fresh support and possibly reignite upward momentum.
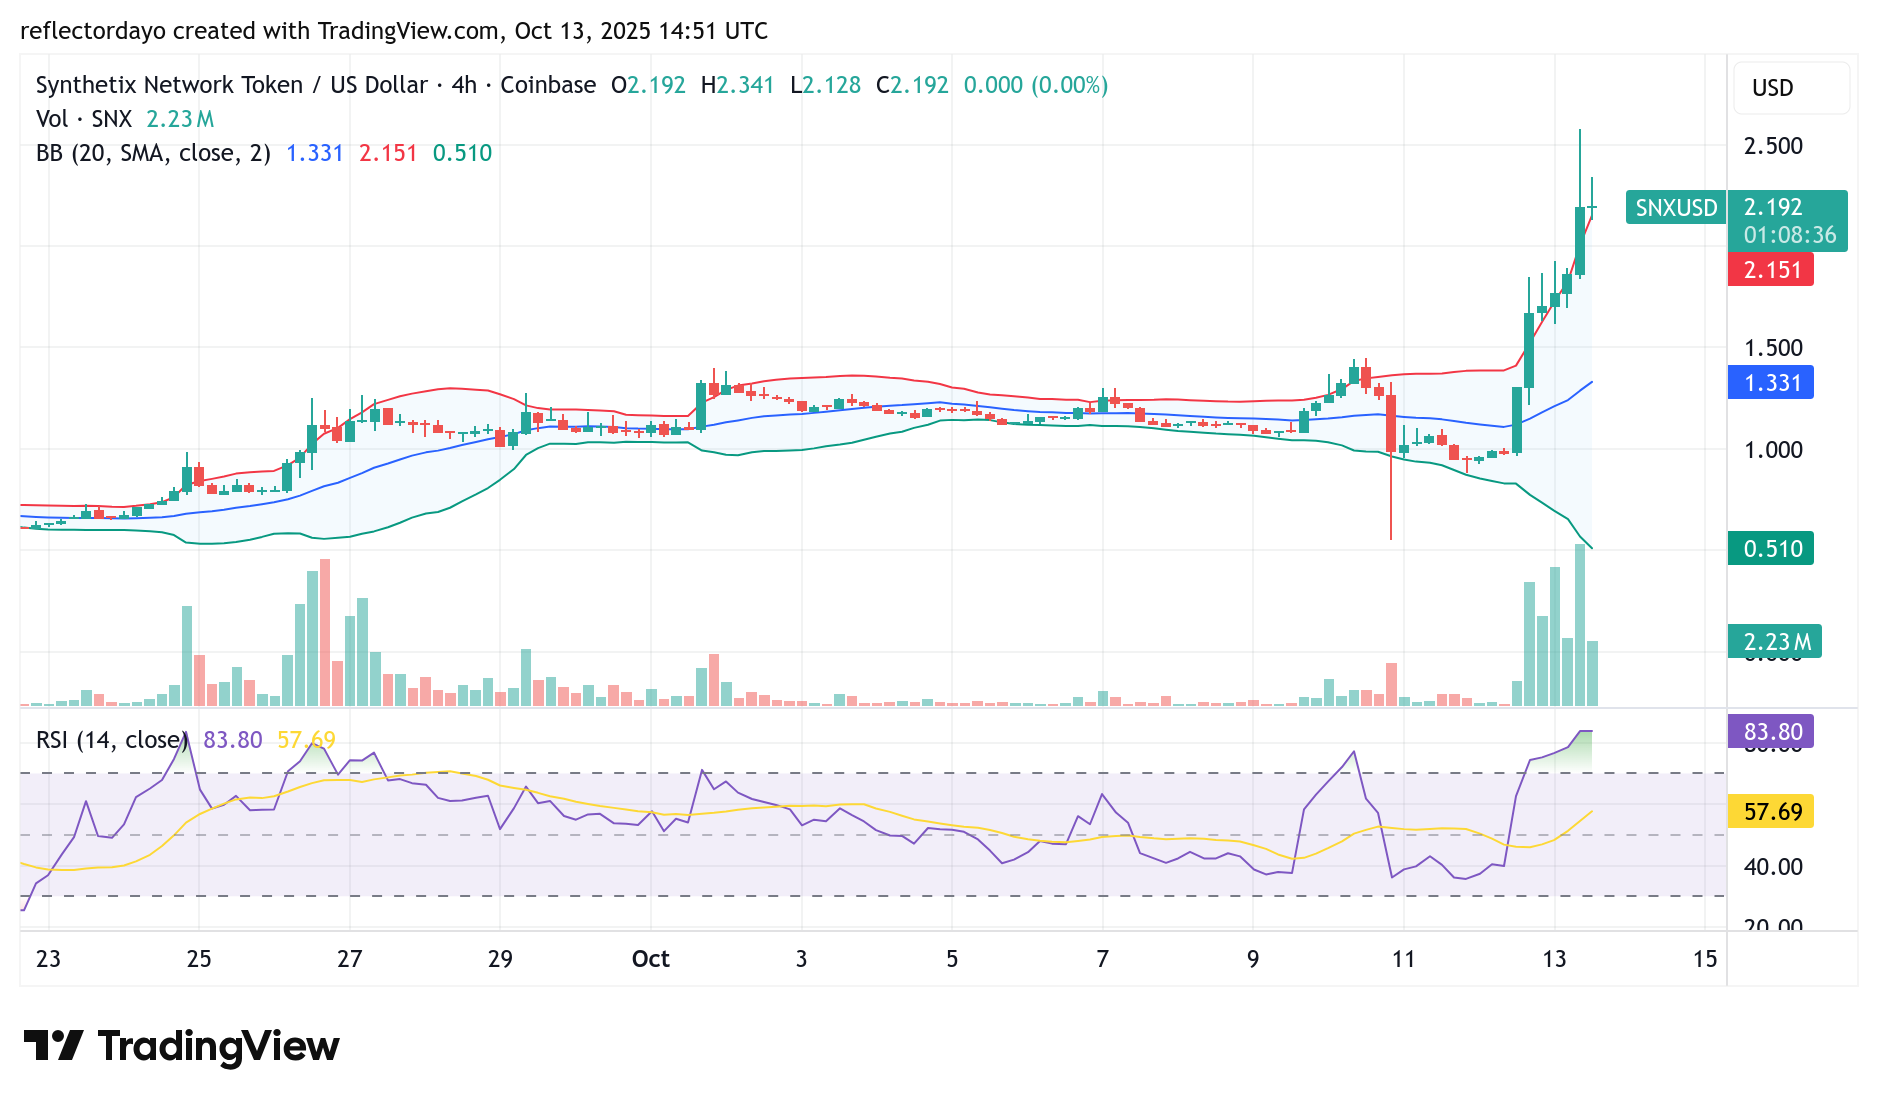
SNX/USD 4-Hour Chart Outlook
At present, the bulls are striving to keep the market buoyant around the $2.20 price level. The volume indicator reflects strong investor interest, suggesting that market participation remains high. Should the pullback extend toward the $2.00 support level, a rebound toward the $2.50 resistance zone remains a likely scenario.
However, it is important to note that, according to technical indicators—particularly the Relative Strength Index (RSI)—the market currently sits in the overbought region. This signals a potential correction in the near term. If such a retracement occurs, the $2.20 level may serve as a crucial rebound point, where renewed buying momentum could emerge to sustain the bullish structure.