Litecoin (LTC/USD) Bulls Strive to Maintain Momentum at $126
Estimated Reading Time: 2 minutes
Don’t invest unless you’re prepared to lose all the money you invest. This is a high-risk investment and you are unlikely to be protected if something goes wrong. Take 2 minutes to learn more

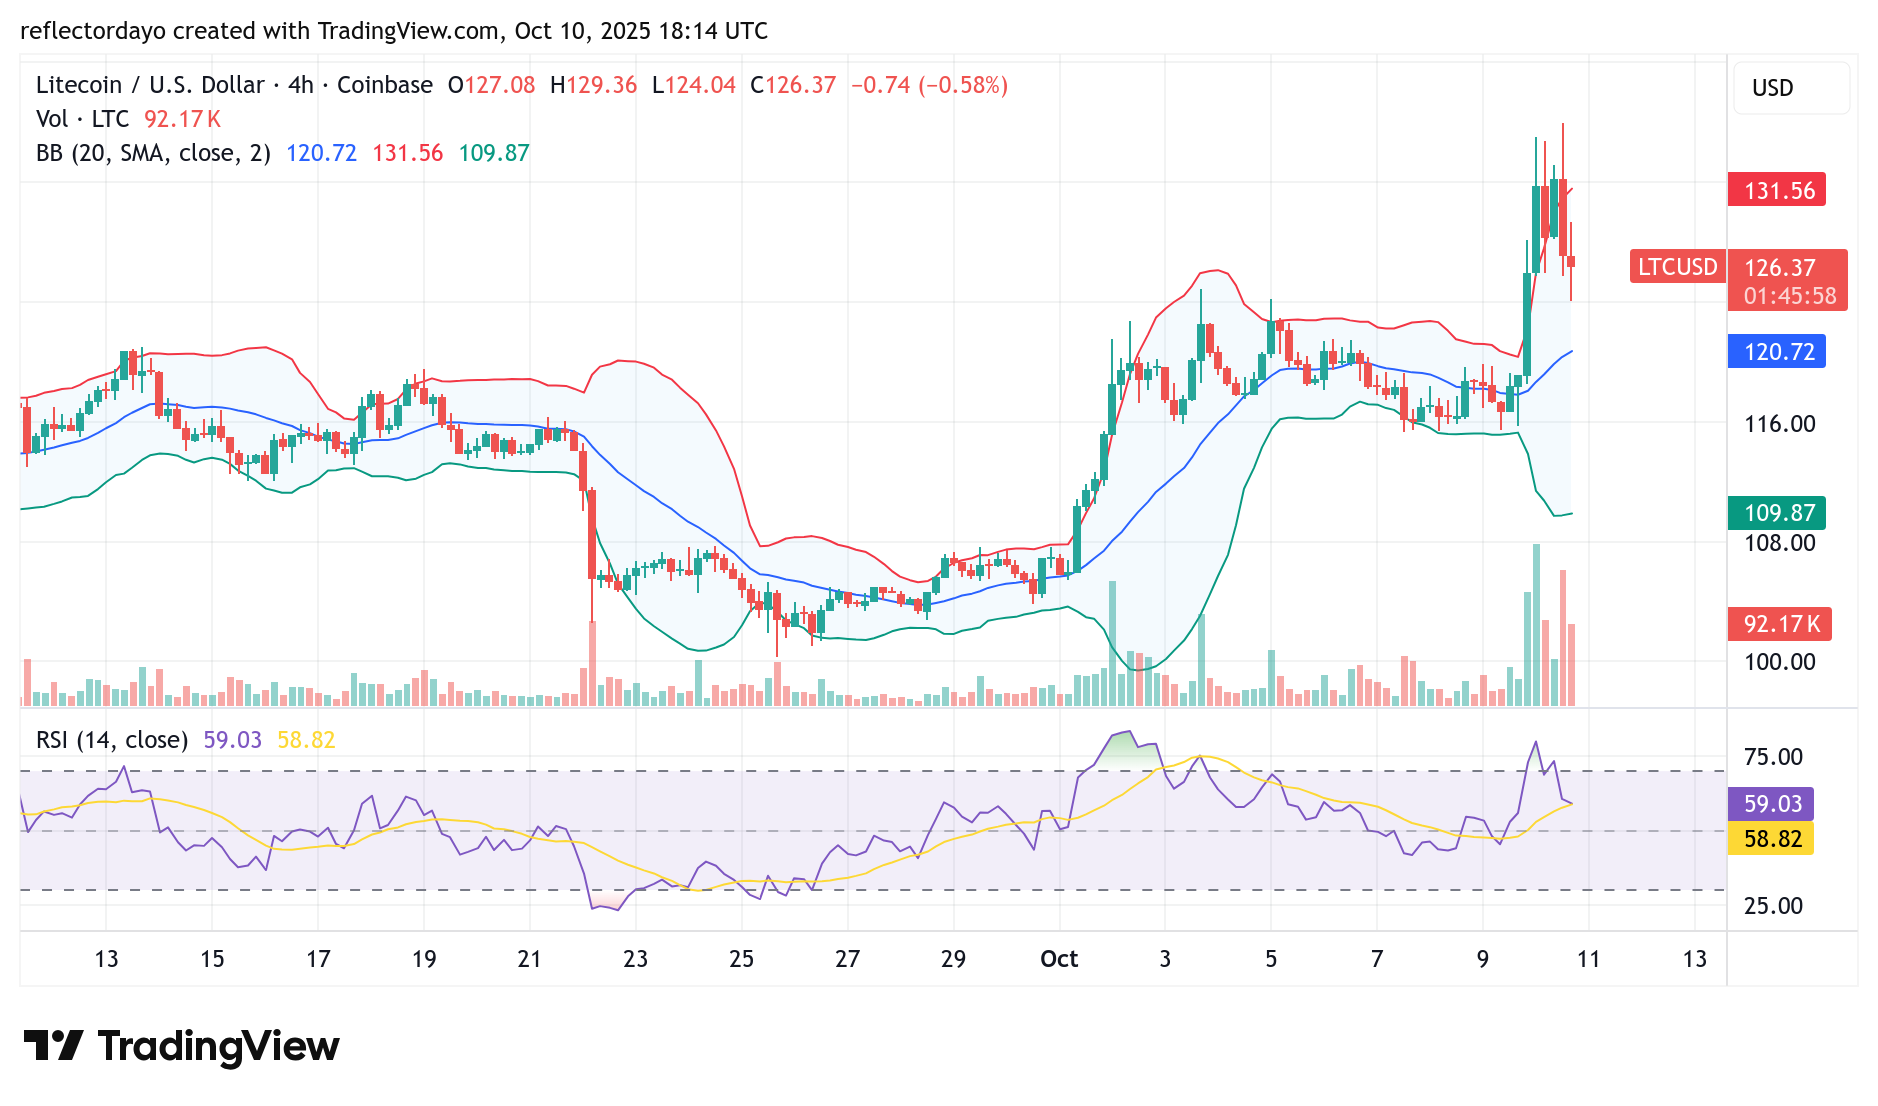
On October 9, Litecoin (LTC/USD) broke out of a prolonged consolidation phase that had persisted around the $118 price level, where demand and supply had been closely balanced. This period was marked by heightened volatility as buyers and sellers battled for dominance. By the end of September, the market had declined to a low of $100, sparking renewed buying interest that propelled prices toward the $135 region. However, in October, bullish traders appear focused on defending gains and stabilizing the market around the $126 support level.
Litecoin (LTC/USD) Market Data
- LTC/USD Price Now: $126
- LTC/USD Market Cap: $9.7 billion
- LTC/USD Circulating Supply: 76 million LTC
- LTC/USD Total Supply: 84 million LTC
- LTC/USD CoinMarketCap Ranking: #18
Key Levels to Watch
- Resistance: $130, $135, $140
- Support: $116, $113, $110
Litecoin (LTC/USD) Daily Chart Outlook
The Bollinger Bands indicator shows a wide spread, ranging from approximately $98 to $135—signaling heightened crypto market volatility. Under such conditions, significant price swings are likely. Despite this, bulls are working to maintain control above the $116 support level.
In today’s trading session, Litecoin buyers have identified the $124 region as a potential higher support zone, as bearish attempts to push prices lower have been rejected around this level. If bullish momentum persists, Litecoin may remain buoyant above this threshold. However, the Relative Strength Index (RSI) currently reads around 68, suggesting that the market is approaching overbought territory and could be due for a short-term correction.
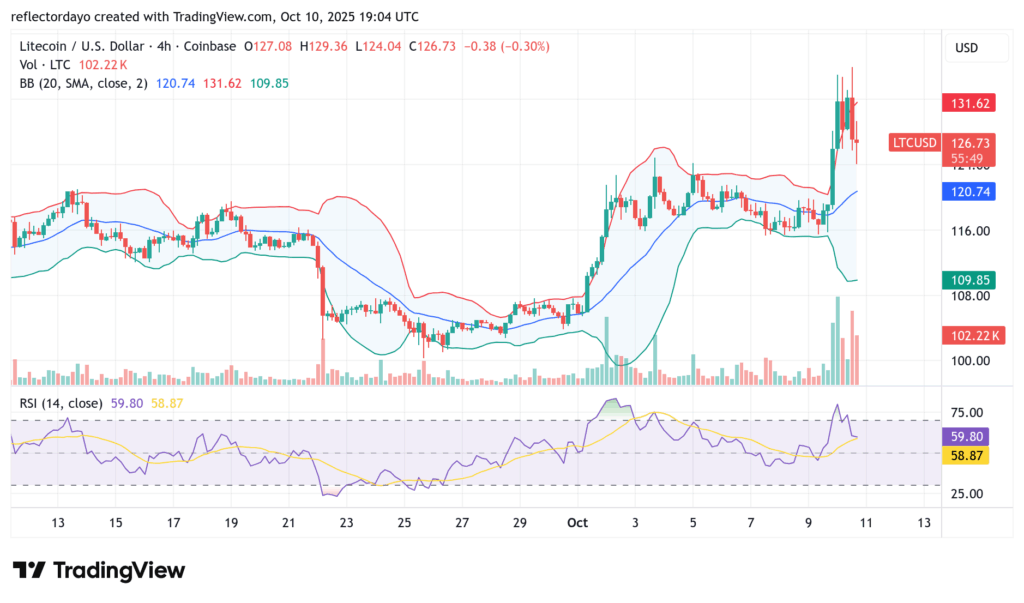
LTC/USD 4-Hour Chart Outlook
On the shorter timeframe, the market appears to be stabilizing within the bullish zone, with the $126 level emerging as a key support area and a potential reentry point for optimistic traders. The current session is represented by a spinning top candlestick, indicating indecision between buyers and sellers. As a result, a period of consolidation around the $126 price level is likely in the near term.