Polygon (ex-MATIC) Price Prediction: POL/USDT Pulls Back After Break Above $0.2300 Base Level
Estimated Reading Time: 3 minutes
Don’t invest unless you’re prepared to lose all the money you invest. This is a high-risk investment and you are unlikely to be protected if something goes wrong. Take 2 minutes to learn more

Date: May 17, 2025
The Polygon (ex-MATIC) coin has been trending upwards recently. However, the market has experienced a moderate downward retracement. Nevertheless, this has only corrected the price to around the $0.2300 mark.
POL/USDT Long-Term Trend: Bullish (Daily Chart)
Key Price Levels:
Resistance: $0.2500, $0.3000, $0.3500
Support: $0.2000, $0.1500, $0.1000
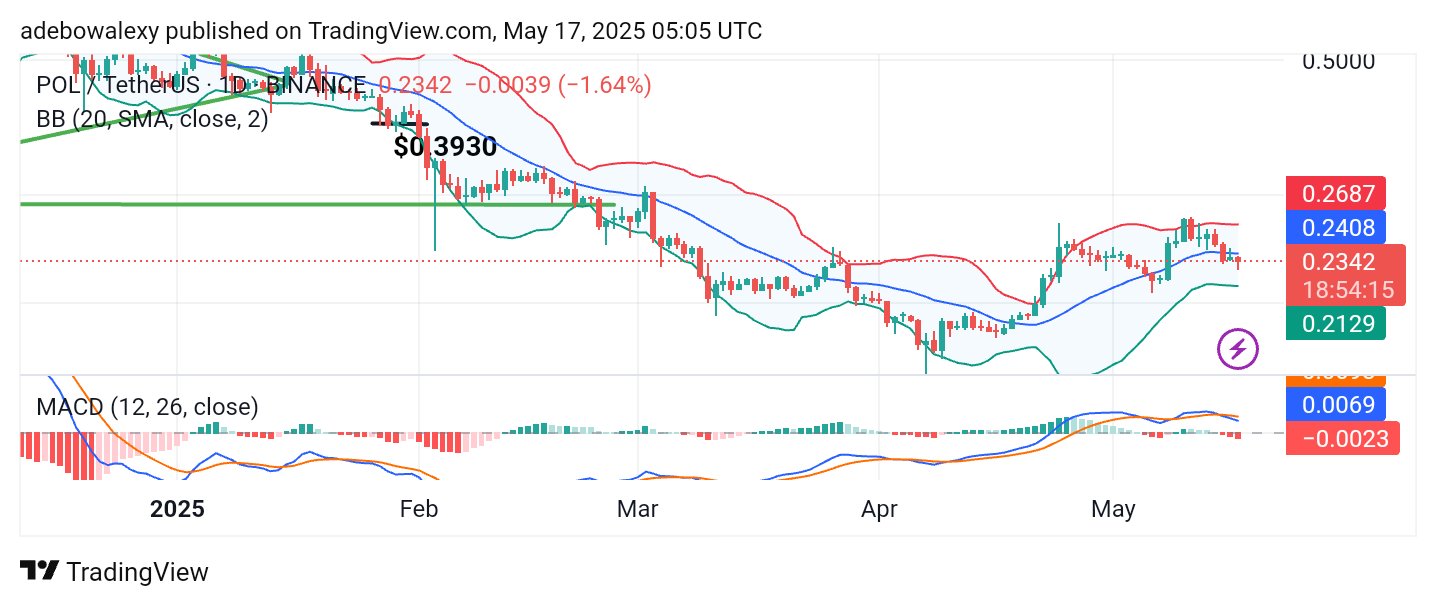
On the daily chart, the price action of Polygon (ex-MATIC) remains above the $0.2300 level. However, the recent trend has been downward. As a result, the latest price candle appears red, though it shows some upward contraction. The candle has positioned the market below the mid-Bollinger Bands, despite exhibiting some upward pressure.
The Moving Average Convergence Divergence (MACD) lines are above the equilibrium level. However, a downward crossover has occurred, and the MACD histogram bars are solid red and positioned below the indicator’s baseline, suggesting weakening bullish momentum.
Polygon (ex-MATIC) Price Prediction: POL/USDT Downward Retracement Faces Resistance
Based on available indicators, the Polygon (ex-MATIC) market appears to be undergoing a downward retracement. Although the price has dipped below a key technical level, the current session shows signs of upward contraction. The most recent candle displays a lower shadow, indicating buying pressure.
While the MACD lines exhibit a sideways movement following a previous downward crossover, the histogram bars are solid green. This suggests that although bullish forces are emerging, they currently lack the strength to initiate a significant upward move.
Polygon (ex-MATIC) Price Prediction: POL/USDT Posts Minimal Bounce So Far
In the 4-hour chart, price action suggests that a rebound has begun in the most recent session. While the previous session showed only a slight contraction, the current candle is moderately bullish. Technically, this suggests increased buying activity.
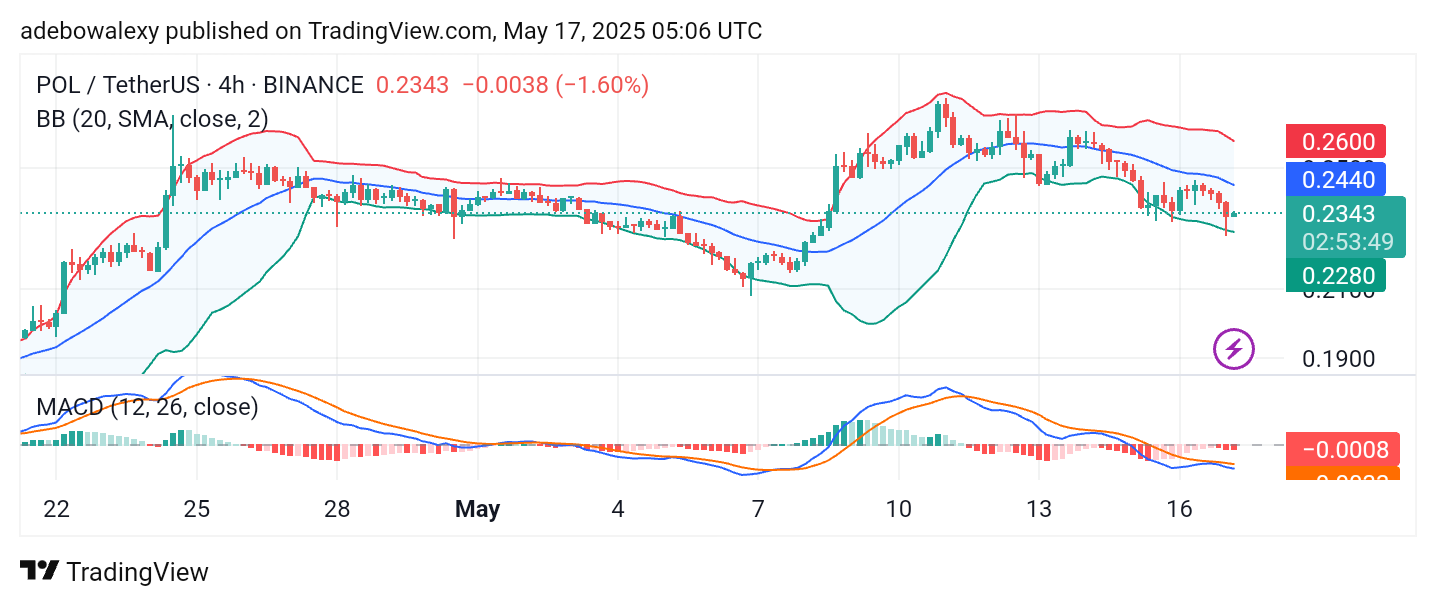
However, the price remains below the middle Bollinger Bands, signaling that short-term traders should exercise caution. Similarly, the MACD lines remain below the equilibrium level and maintain a downward trajectory, which indicates that the short-term trend remains bearish. As a result, traders may consider respecting the current trend and keep short-term upside targets below the $0.2440 level.