Solana (SOL) Price Prediction: SOL/USDT Starts a Bounce Above $170
Estimated Reading Time: 3 minutes
Don’t invest unless you’re prepared to lose all the money you invest. This is a high-risk investment and you are unlikely to be protected if something goes wrong. Take 2 minutes to learn more
Date: May 16, 2025
The Solana market has successfully breached the $170 price level. The market moved toward the $180 mark, but headwinds initiated a downward correction. Currently, the market is rebounding off support at the psychological price level of $170. Let’s examine how this may play out shortly.
SOL/USDT Long-Term Trend: Bullish (Daily Chart)
Key Price Levels:
Resistance: $180, $200, $220
Support: $170, $160, $150
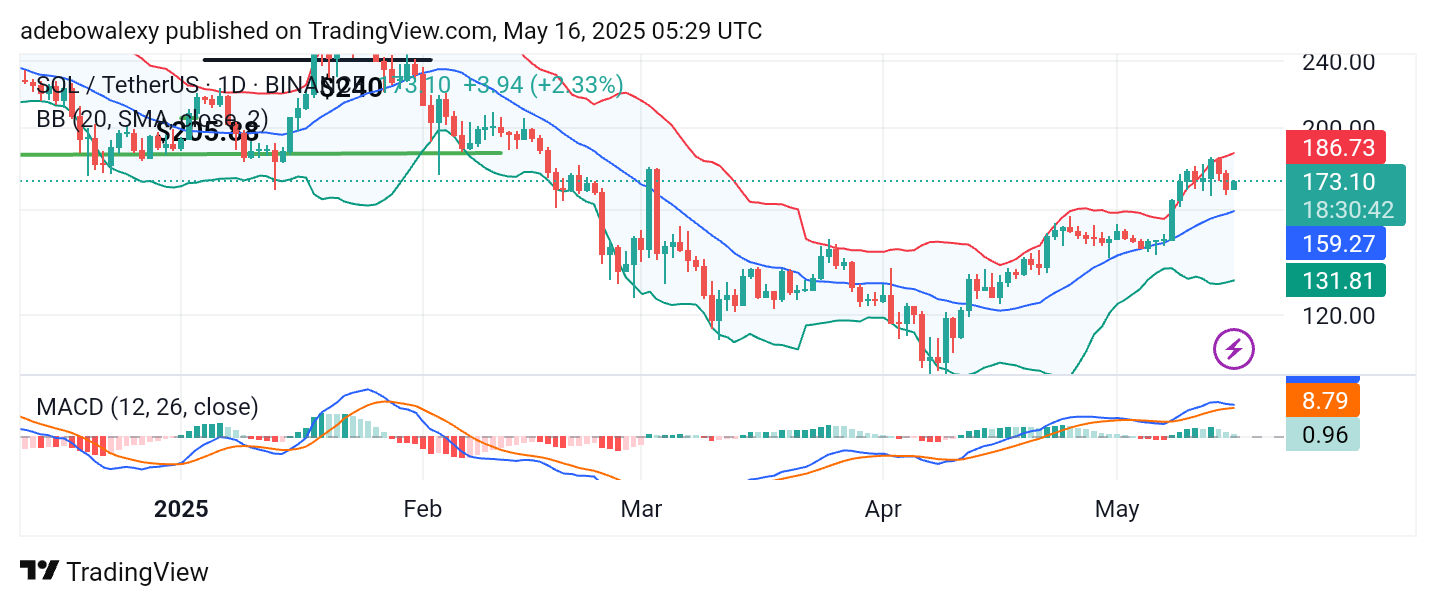
The latest price candle on the Solana daily chart shows an upward rebound, indicated by the green candle representing the ongoing session. The price remains above the middle line of the Bollinger Bands indicator. The market had only declined for two sessions, and as a result, the Bollinger Bands indicator maintains an upward trajectory. Meanwhile, the Moving Average Convergence Divergence (MACD) indicator lines remain above the equilibrium level. The terminal ends of the indicator are slightly sideways due to the brief downward retracement over the past two sessions.
Solana (SOL) Price Prediction: SOL/USDT Uptrend May Continue
Based on current indications from technical indicators, it appears that Solana’s price action may resume its upward movement. This view is supported by the rebound occurring in the ongoing session, which has happened above the middle Bollinger Band.
Likewise, the MACD lines are still above the equilibrium level. In contrast to the previous downward trend, the current session seems to have introduced a shift in market direction. Based on this development, the market may continue its upward correction.
Solana (SOL) Price Prediction: SOL/USDT Keeps Pushing Upwards
The ongoing session in the Solana 4-hour chart remains bullish, keeping price action on an upward trajectory. However, the latest price candle appears relatively small at the time of writing. Additionally, price action is currently below the middle line of the Bollinger Bands, suggesting that it may be facing significant resistance.
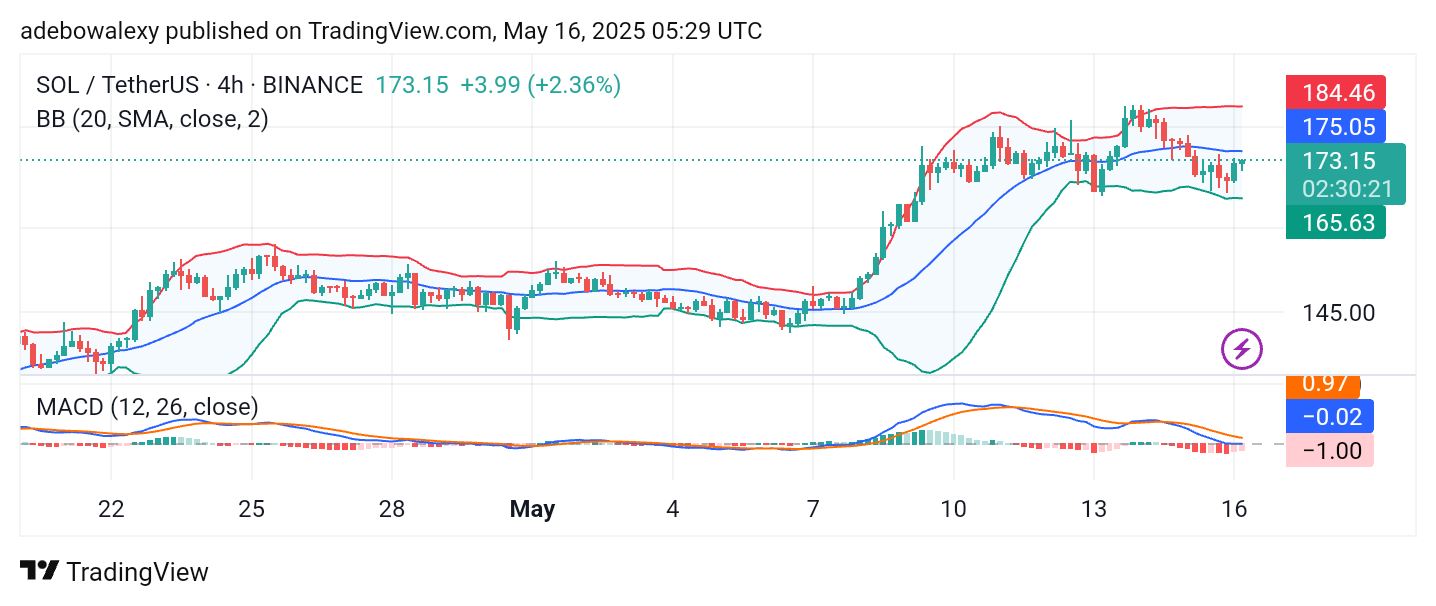
The MACD lines are still above the equilibrium level, while the histogram bars have turned pale red. As a result, the MACD lines are now trending sideways due to the recent upside retracement. If the market can break above the middle Bollinger Band, it may continue its upward movement toward the $180 level, and potentially further toward $200.