Tamadoge (TAMA/USD) Bulls Hold Their Ground as Price Slips Below $0.00045
Estimated Reading Time: 3 minutes
Don’t invest unless you’re prepared to lose all the money you invest. This is a high-risk investment and you are unlikely to be protected if something goes wrong. Take 2 minutes to learn more
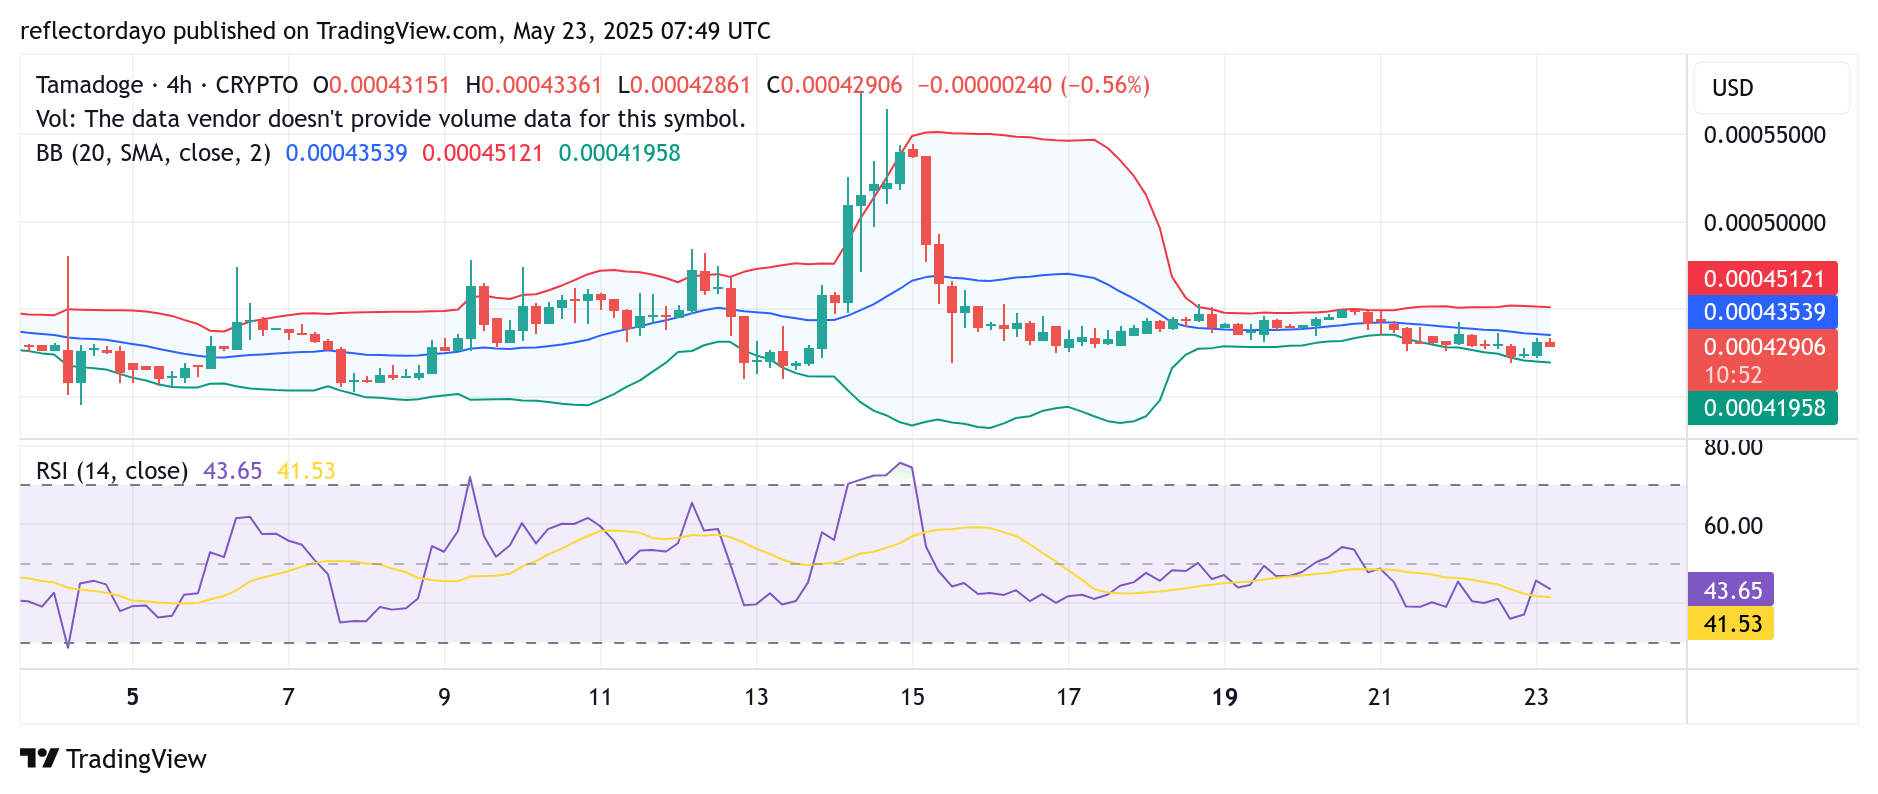
Tamadoge (TAMA/USD) continues to trade within a defined consolidation range, though recent price action reflects a slight dip in bullish momentum. The pair has slipped marginally below the key $0.00045 level, with buyers now regrouping around the $0.00042 support zone in response to mounting bearish pressure.
Despite this minor downturn, the broader market structure remains unchanged. The current pullback still falls within the established range, suggesting that the overall trend remains neutral for now. Bullish presence at the $0.00045 level remains evident, and unless there is a decisive break below support, the market could still pivot toward another upward attempt.
Traders should closely watch how price behaves around the $0.00042–$0.00045 corridor, as it may determine the next directional move.
Key Price Zones to Watch
- Resistance: $0.00047, $0.00050, $0.00055
- Support: $0.00043, $0.00040, $0.00035
Tamadoge (TAMA/USD) Holds Firm as Bulls Defend $0.00042 Amid Shifting Momentum
After a period of heightened volatility, the Tamadoge (TAMA/USD) market has entered a phase of consolidation, with price action stabilizing around the $0.00045 level. This equilibrium reflects a temporary balance between supply and demand, keeping the market in a relatively tight range.
However, recent chart observations indicate a slight shift in momentum. Selling pressure briefly intensified, pushing the price down to approximately $0.00042. Despite this bearish dip, the bulls quickly responded, lifting the price back to around $0.00043 and neutralizing short-term pessimism.
The swift recovery from the $0.00042 level highlights the persistent strength of bullish sentiment. This support zone remains critical, and the ability of buyers to defend it may determine whether the market can mount a sustainable upward push in the coming sessions.

Tamadoge (TAMA/USD) 1-Hour Chart: RSI Signals Bullish Advantage as Price Approaches Resistance
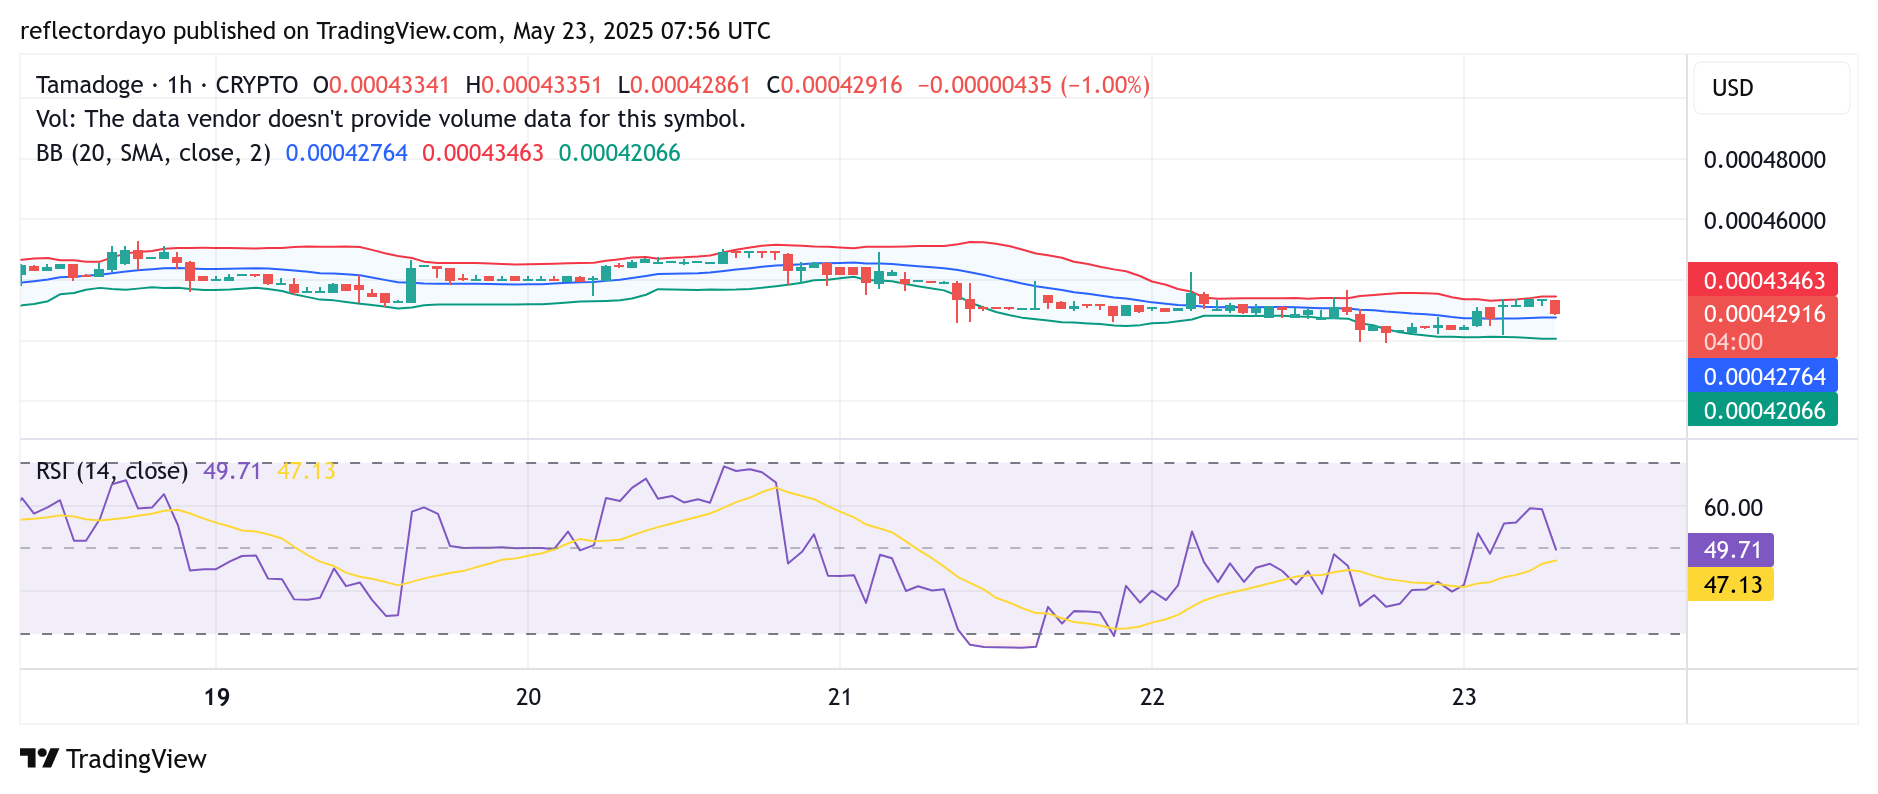
Zooming in on the 1-hour chart, the Relative Strength Index (RSI) reveals a shift in momentum, favoring the bulls. The RSI is currently trending above its midpoint, indicating growing buying pressure and suggesting that bullish sentiment is beginning to dominate.
Price action is also holding above the short-term range, with signs of increasing upward volatility starting to emerge. This may indicate that the market is preparing for a stronger move.
However, as TAMA/USD approaches the key $0.00045 resistance level, traders should remain cautious. This area may present a short-term barrier, potentially slowing the current rally. Monitoring RSI behavior and volume dynamics will be crucial for anticipating the next move and positioning accordingly.
Buy Tamadoge!
There’s no mobile runner out there quite like #TamadogePursuit! 🏃♂️
1️⃣ Sign up – start with 20 free credits for a boost!
2️⃣ Climb up the leaderboards.
3️⃣ Win $TAMA rewards!Play Now! 👇
📱Android: https://t.co/Of8SYALRzL
📱 iOS: https://t.co/IthvqovwAH pic.twitter.com/84HNqob9Rf— TAMADOGE (@Tamadogecoin) September 10, 2024