Tamadoge (TAMA/USD): Bulls Poised for a Breakout at $0.0012
Estimated Reading Time: 3 minutes
Don’t invest unless you’re prepared to lose all the money you invest. This is a high-risk investment and you are unlikely to be protected if something goes wrong. Take 2 minutes to learn more
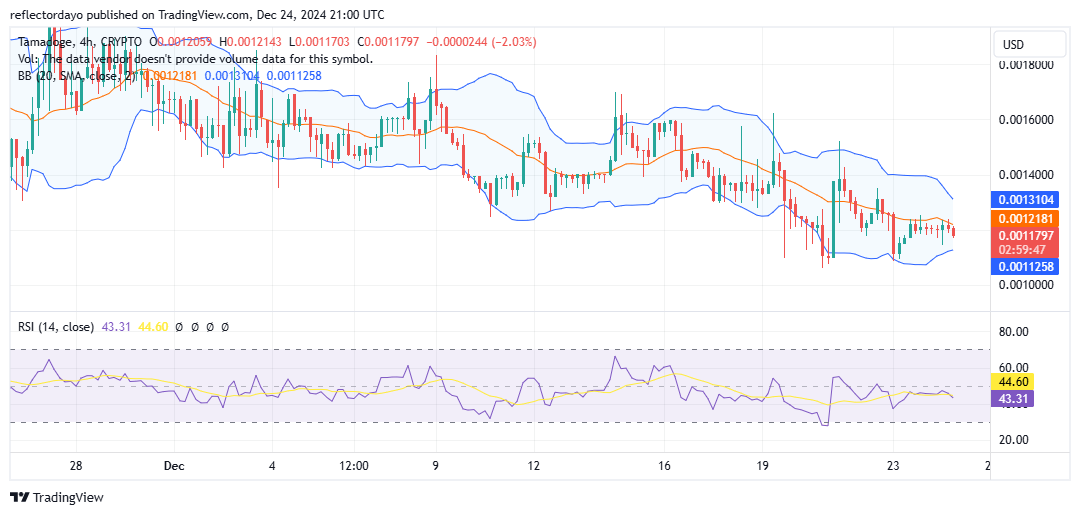
Since the market dropped from the $0.0018 price level, a descending trend has been observed in the Tamadoge market. Every attempt to push the price upward has been met with subsequent declines in price action. However, as the bearish momentum reached the $0.0012 support level, a renewed bullish bias began to emerge. This development has led to market consolidation around this critical price point.
Key Levels
- Resistance: $0.0018, $0.0019, and $0.0020
- Support: $0.001, $0.0009 and $0.0008
TAMA/USD Price Analysis: The Indicators’ Point of View
Upon reaching the critical $0.0012 price level, the Tamadoge market entered a consolidation phase, indicating that bearish momentum is encountering significant bullish resistance. This dynamic suggests the potential for a reversal toward an upward trend. The Bollinger Bands indicator is beginning to narrow as buyers and sellers engage in a standoff, reducing market volatility.
The convergence of support and resistance levels further signals that the market is gearing up for a major price movement. While the descending peaks highlight a persistent and aggressive bearish trend, the $0.0012 level remains significant. During the last bullish rally in November, this price level acted as a strong foundation, propelling the market to a high of $0.0023. This historical significance implies that $0.0012 could once again foster enough bullish momentum to spark a rebound in the near future.
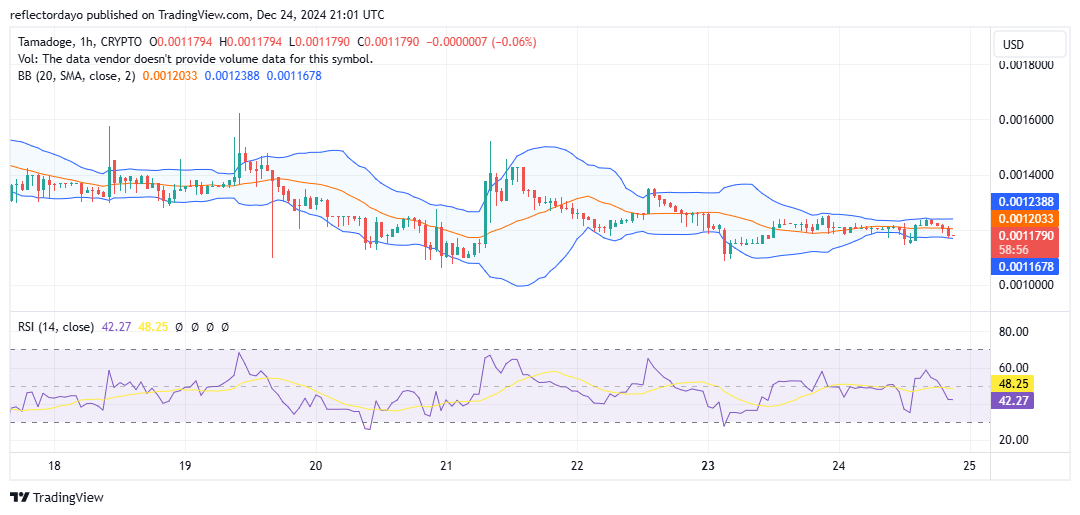
Tamadoge Short-Term Outlook: 1-Hour Chart
Zooming in on the smaller time-frame outlook, there is clear evidence of bullish bias around the $0.0012 level, which could facilitate a market bounce once the prevailing bearish momentum, currently constrained within a horizontal trading range, dissipates. The Bollinger Bands have converged into a narrow channel, closely mirroring the current price consolidation, signaling the potential for an imminent breakout.
The first key resistance level to watch is $0.0014. A breakout above this level could trigger a bullish rally, accompanied by increased market volatility, potentially causing the price to rise rapidly. Traders should remain alert and prepared to capitalize on this opportunity.
Buy $TAMA!
There’s no mobile runner out there quite like #TamadogePursuit! 🏃♂️
1️⃣ Sign up – start with 20 free credits for a boost!
2️⃣ Climb up the leaderboards.
3️⃣ Win $TAMA rewards!Play Now! 👇
📱Android: https://t.co/Of8SYALRzL
📱 iOS: https://t.co/IthvqovwAH pic.twitter.com/84HNqob9Rf— TAMADOGE (@Tamadogecoin) September 10, 2024