Tamadoge (TAMA/USD): Bulls Poised for a Breakout to Higher Levels
Estimated Reading Time: 2 minutes
Don’t invest unless you’re prepared to lose all the money you invest. This is a high-risk investment and you are unlikely to be protected if something goes wrong. Take 2 minutes to learn more

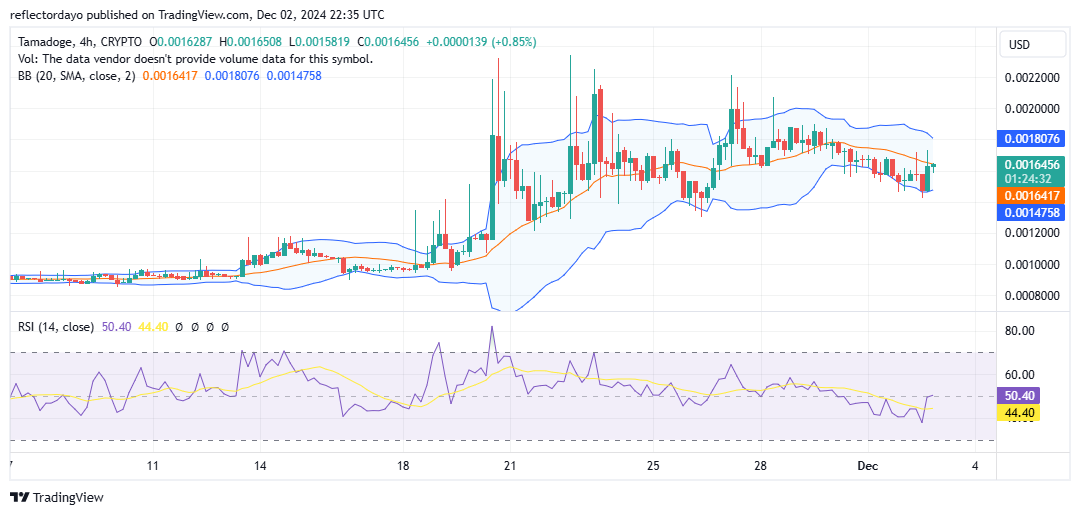
The Tamadoge market has recently demonstrated impressive bullish momentum, signaling a strong recovery from bearish conditions. The price surged past critical levels at $0.0010 and $0.0015, reaching a peak above $0.0020. However, this upward move in the crypto signal triggered profit-taking, leading to a pullback and a temporary price reversal. Currently, the bulls are striving to counter bearish sentiment around the $0.0016 level, attempting to establish a solid foundation to reclaim upward momentum and drive the market higher.
Key Levels
- Resistance: $0.0018, $0.0019, and $0.0020
- Support: $0.001, $0.0009 and $0.0008
TAMA/USD Price Analysis: The Indicators’ Point of View
Tamadoge buyers and sellers are currently vying for control of the market around the $0.0016 level, reflecting a balance between bullish and bearish forces. This equilibrium is mirrored in the RSI, which now hovers around the midpoint, indicating that the market is in a neutral position.
If the tug-of-war between demand and supply persists, volatility may decrease, causing the market to consolidate further around this level. This phase of consolidation could extend until the market finds the momentum for a decisive breakout.
Tamadoge Short-Term Outlook: 1-Hour Chart
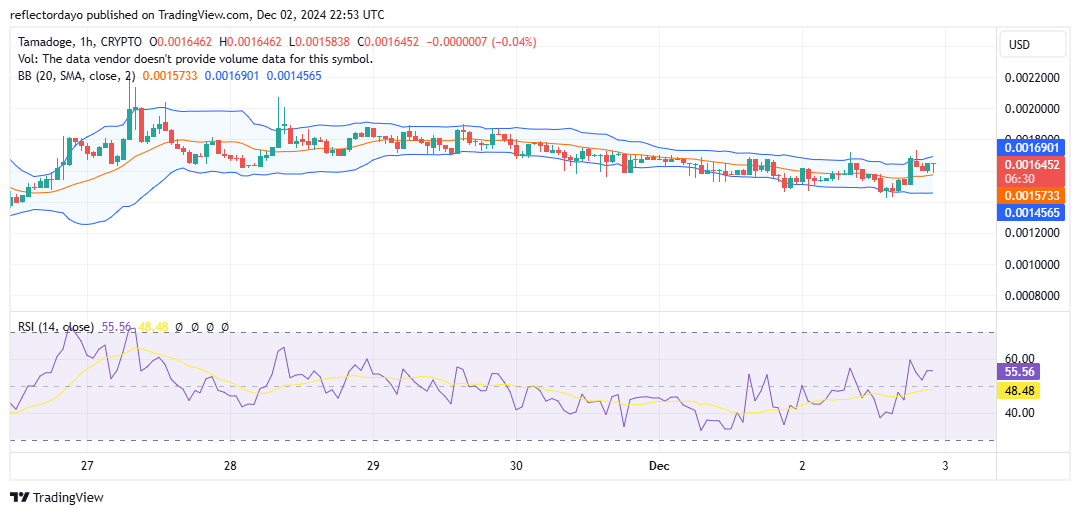
On the 1-hour chart, the price action is currently in a consolidation phase, with the price consistently hovering around the $0.0016 level. This tight oscillation is likely to establish $0.0016 as a potential support level.
A rebound from this support could trigger renewed bullish momentum, aiming for a return to the $0.0020 resistance. Furthermore, the development of a higher support level above $0.0016, potentially at $0.0017, could bolster the market’s bullish outlook in the short term.
Buy TAMA/USD!
There’s no mobile runner out there quite like #TamadogePursuit! 🏃♂️
1️⃣ Sign up – start with 20 free credits for a boost!
2️⃣ Climb up the leaderboards.
3️⃣ Win $TAMA rewards!Play Now! 👇
📱Android: https://t.co/Of8SYALRzL
📱 iOS: https://t.co/IthvqovwAH pic.twitter.com/84HNqob9Rf— TAMADOGE (@Tamadogecoin) September 10, 2024