Tamadoge (TAMA/USD) Bulls Poised for a Comeback as Price Hovers Just Below $0.0018
Estimated Reading Time: 3 minutes
Don’t invest unless you’re prepared to lose all the money you invest. This is a high-risk investment and you are unlikely to be protected if something goes wrong. Take 2 minutes to learn more
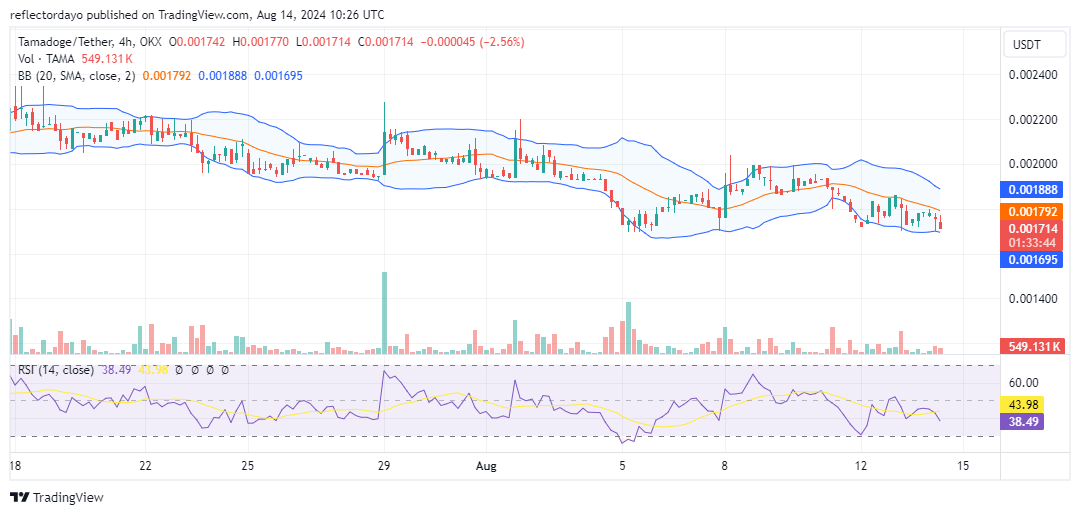
In our previous analysis of the Tamadoge market, we highlighted the potential for the bulls to reverse the trend at the $0.0018 price level. However, as bearish pressure persisted, the market stagnated around this level, with bulls now retreating slightly below $0.0018 to around $0.0017, likely regrouping to push the market upward. While the current 4-hour trading session indicates strong bearish activity, a closer look at the indicators suggests a possible bullish reversal.
Key Levels
- Resistance: $0.013, $0.014, and $0.015
- Support: $0.0018, $0.00175 and $0.0016
TAMA/USD Price Analysis: The Indicators’ Point of View
Amid the ongoing bearish pressure in the market, the Bollinger Bands now reflect a downward-moving price channel. Additionally, a shooting star candlestick has formed in the latest 4-hour trading session—characterized by a small body and a long upper shadow—which is typically a bearish signal. However, its appearance in the current market context does not necessarily indicate a continuation of the bearish trend.
This candlestick has emerged at the bottom of a downtrend, after the price action found support. This crypto signal suggests that the bears are challenging the bulls at the $0.0017 level, but they may not succeed in pushing the price lower. There are two key reasons for this: first, the bearish attempts have been consistently rejected at this level, reinforcing it as a strong support; second, the volume indicator shows that bearish momentum is waning, with more traders adopting a bullish stance since the market has been unable to break through this price level. Therefore, a bullish breakout may be imminent.
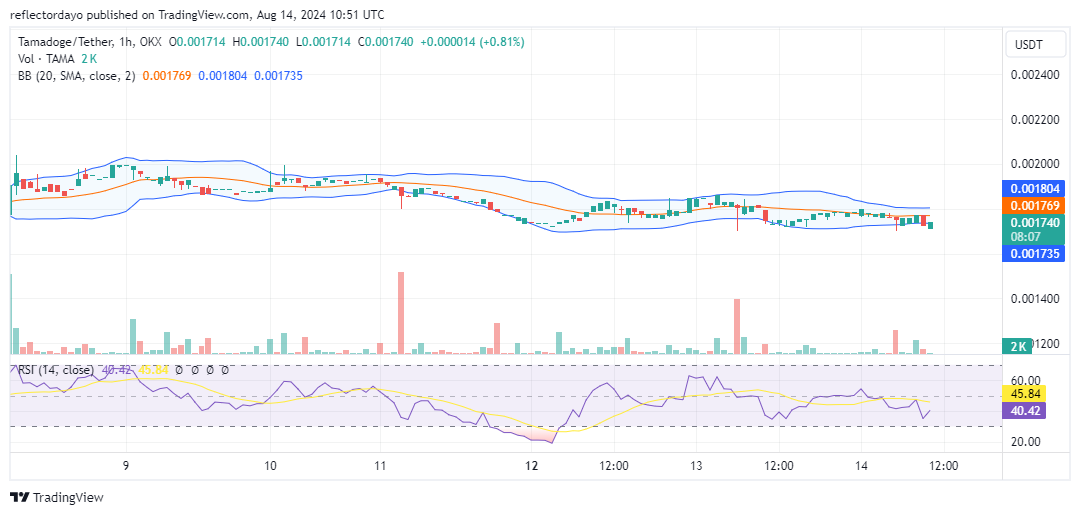
Tamadoge Short-Term Outlook: 1-Hour Chart
From this perspective, the market is indicating a consolidation trend, with neither bulls nor bears able to push the price out of the horizontal range. However, this trend could favor the bulls, as it is occurring around the $0.0071 price level, a key support zone. Currently, the 1-hour trading session has formed a doji candlestick just below the lower standard deviation, which may signal an impending upward price correction.
Buy TAMA/USD!
Test your speed with the sharpest mobile runner – #TamadogePursuit! 🏃♀️ 💨
1️⃣ Get started – Sign up with 20 free credits for a boost 🔋
2️⃣ Rise up – Play games and climb the leaderboards 🆙
3️⃣ Earn $TAMA – Win prizes with weekly giveaways for top players! 🥇 pic.twitter.com/uavYZww4rI
— TAMADOGE (@Tamadogecoin) August 12, 2024