Tamadoge (TAMA/USD): Bulls Stand Firm at $0.0007 as Market Struggles for Direction
Estimated Reading Time: 3 minutes
Don’t invest unless you’re prepared to lose all the money you invest. This is a high-risk investment and you are unlikely to be protected if something goes wrong. Take 2 minutes to learn more

As bearish pressure persists in the Tamadoge market, bulls are holding firm, attempting to defend their position near the $0.0007 price level. Although the market has dipped slightly below this level, it is exhibiting signs of consolidation, with demand and supply closely matching around $0.0008. Based on technical indicators, there are signals that the market may be on the verge of a significant upward breakout, potentially pushing the price toward $0.0008.
Key Levels
- Resistance: $0.0009, $0.0010, and $0.0011
- Support: $0.00065, $0.00060 and $0.00055
TAMA/USD Price Analysis: The Indicators’ Point of View
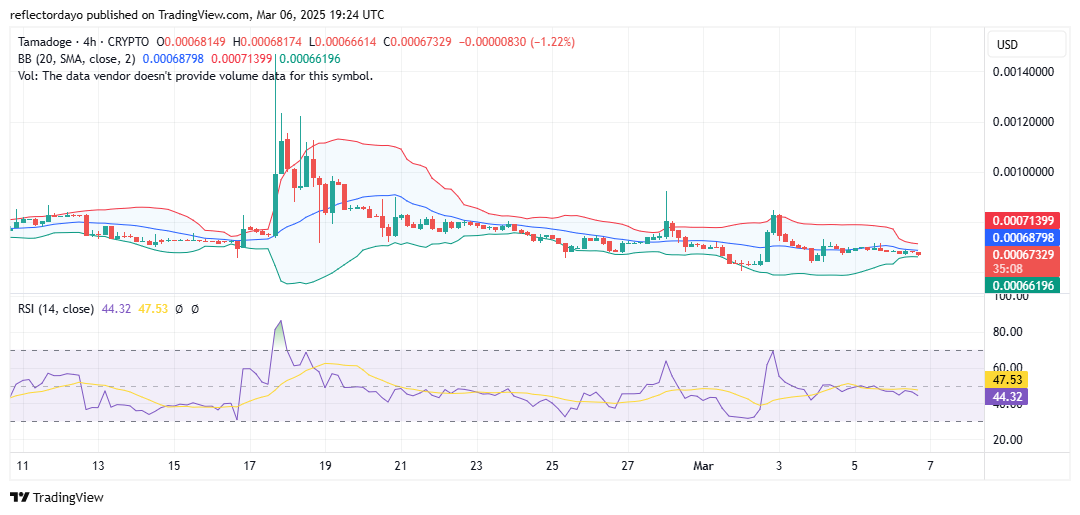
As the Tamadoge price action reflects the ongoing struggle between buyers and sellers, the market remains consolidated around the $0.00068 level. The Bollinger Bands indicator has narrowed, enveloping the horizontally moving price action, signaling a sharp decline in market volatility due to the standoff between bulls and bears. This volatility squeeze suggests that the market is primed for a significant price movement, with a potential breakout to the upside.
Currently, bulls are holding firm at the key support level of $0.00067. Meanwhile, the RSI line is moving sideways around the 44 level. Since it remains below the midpoint, the bullish position is under bearish pressure, with buyers striving to defend their territory.
Tamadoge Short-Term Outlook: 1-Hour Chart
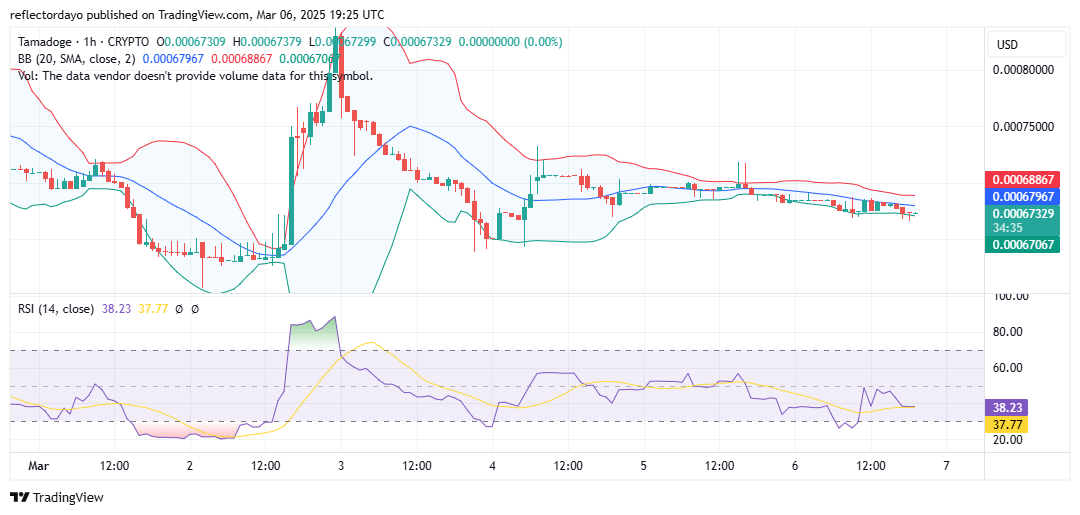
Zooming into the 1-hour chart, despite bearish pressure pushing the market below the 20-day moving average, which currently holds at $0.000679, bullish resilience is evident at the $0.00067 price level. The price action has flattened around this level, signaling strong buyer support and suggesting that the bearish momentum is weakening. Given this indication of exhaustion in selling pressure, the crypto signal appears poised for a potential surge and upward rally in the near term.
Buy TAMA/USD!
Fill your weekend by playing five exhilarating play-to-earn arcade games! 🕹️💰
Battle your way to the top of the weekly leaderboards and load up on $TAMA rewards!
Download on mobile now 👇
📱 Android: https://t.co/D4TjX7gTFl
📱 iOS: https://t.co/0fjJapf5oA pic.twitter.com/6MCruiKcet— TAMADOGE (@Tamadogecoin) September 13, 2024