Tamadoge (TAMA/USD): Bulls Defend $0.0007 as Indecision Persists
Estimated Reading Time: 3 minutes
Don’t invest unless you’re prepared to lose all the money you invest. This is a high-risk investment and you are unlikely to be protected if something goes wrong. Take 2 minutes to learn more
In the previous analysis of the Tamadoge (TAMA) market, it was projected that, given the strength of the bulls at the key support level, the price would surge above $0.0008 toward the $0.0009 level. This projection has been realized; however, the bulls have been unable to sustain the upward momentum, causing the price to retreat back into its previous range.
The TAMA/USD market has been consolidating, with price fluctuations occurring between the $0.0006 support level and the $0.0008 resistance level. The significant gap between these key levels explains why bullish momentum often weakens at higher price points, leading to exhaustion and subsequent pullbacks to support levels such as $0.0006 and $0.00065.
Key Levels
- Resistance: $0.0009, $0.0010, and $0.0011
- Support: $0.00065, $0.00060 and $0.00055
TAMA/USD Price Analysis: The Indicators’ Point of View
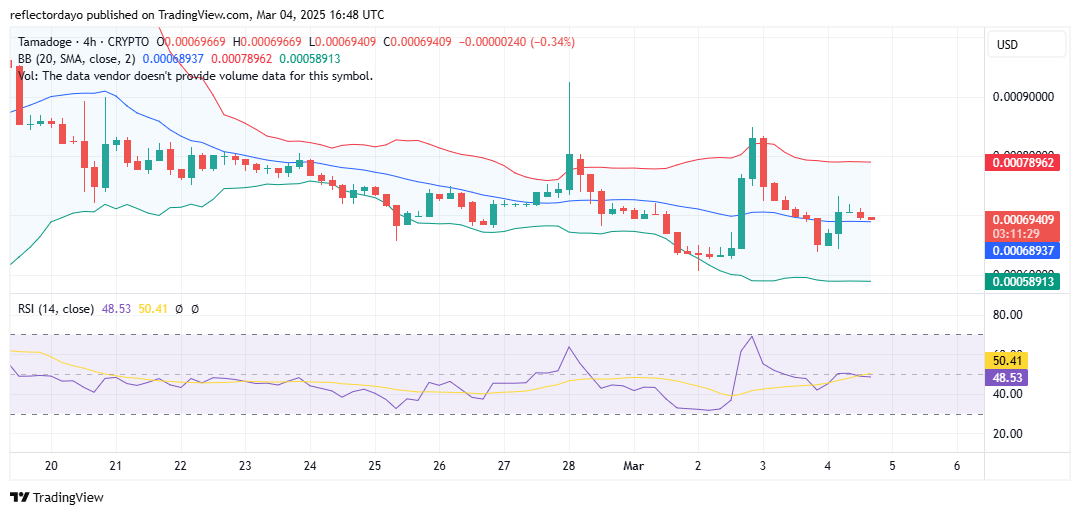
Currently, demand and supply are in a standoff near the $0.0007 price level. The Bollinger Bands, as observed on the 4-hour chart, indicate equilibrium in price action. This balance is delicate, as the substantial bandwidth of the Bollinger Bands suggests that, while the market hovers near $0.0008 with traders remaining indecisive, volatility remains high. Given this wide bandwidth, a sharp Tamadoge price movement—either in favor of the bulls or the bears—is highly likely.
If such a breakout occurs, the market may continue to range within a broader price band. However, if the bulls manage to hold their position around $0.0007, volatility is expected to decline, leading to a contraction in the Bollinger Bands. In this scenario, the bulls could potentially push the price slightly higher, extending the market’s upward movement.
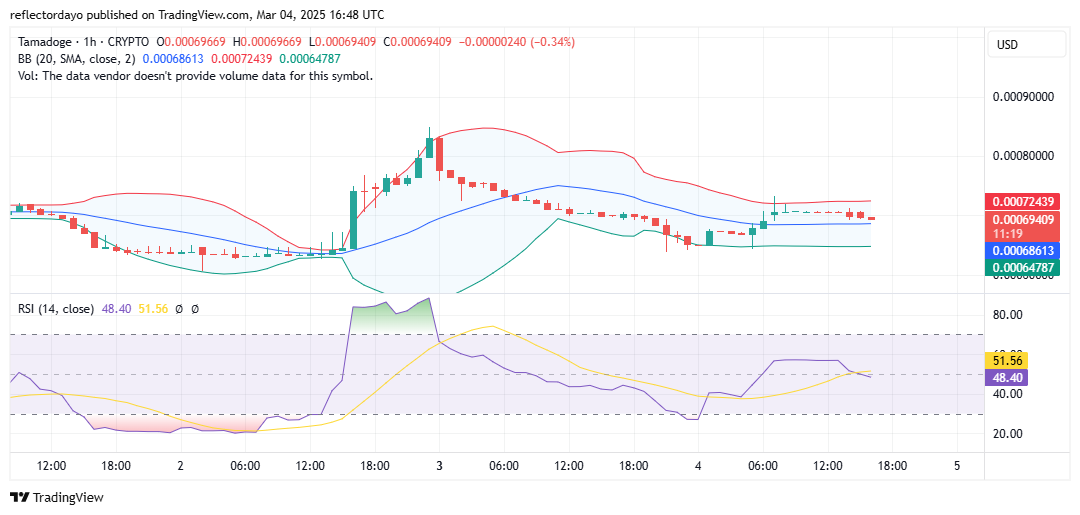
Tamadoge Short-Term Outlook: 1-Hour Chart
On a smaller timeframe, the market shows that the bulls are attempting to establish support around the $0.0007 level. This equilibrium is also reflected in the Relative Strength Index (RSI), where the RSI line currently hovers around the 50 mark, indicating market indecision.
Recent price action reveals that the price initially held firm at the $0.0007 threshold before experiencing a slight breakdown to $0.00069. While this may appear to be a minor bearish victory, the bears quickly lost momentum, suggesting that a sustained downward move is unlikely. Additionally, the emergence of a four-price doji following this brief bearish phase indicates potential market stabilization, with a possible rally back toward the $0.0007 level.
Buy TAMA/USD!
Fill your weekend by playing five exhilarating play-to-earn arcade games! 🕹️💰
Battle your way to the top of the weekly leaderboards and load up on $TAMA rewards!
Download on mobile now 👇
📱 Android: https://t.co/D4TjX7gTFl
📱 iOS: https://t.co/0fjJapf5oA pic.twitter.com/6MCruiKcet— TAMADOGE (@Tamadogecoin) September 13, 2024