Tamadoge (TAMA/USD) Bulls Struggle to Break $0.0006 Resistance as Recovery Gains Momentum
Estimated Reading Time: 3 minutes
Don’t invest unless you’re prepared to lose all the money you invest. This is a high-risk investment and you are unlikely to be protected if something goes wrong. Take 2 minutes to learn more
The last analysis of the Tamadoge market highlighted the emergence of a support level at $0.0005 following a sharp and strong bearish decline triggered at the $0.0008 level. After the market surged and peaked at $0.0008, a significant bearish correction followed. However, the fact that bulls managed to regroup at $0.0005 to establish support indicates their resilience and potential for a rebound. Since the previous analysis, buyers have been gradually staging a recovery. However, the bullish momentum is now encountering resistance at $0.0006, posing a challenge to further upside movement.
Key Levels:
- Resistance: $0.0010, $0.0011, $0.0012
- Support: $0.0005, $0.00045, $0.00040
TAMA/USD Technical Analysis: A Closer Look at Market Indicators
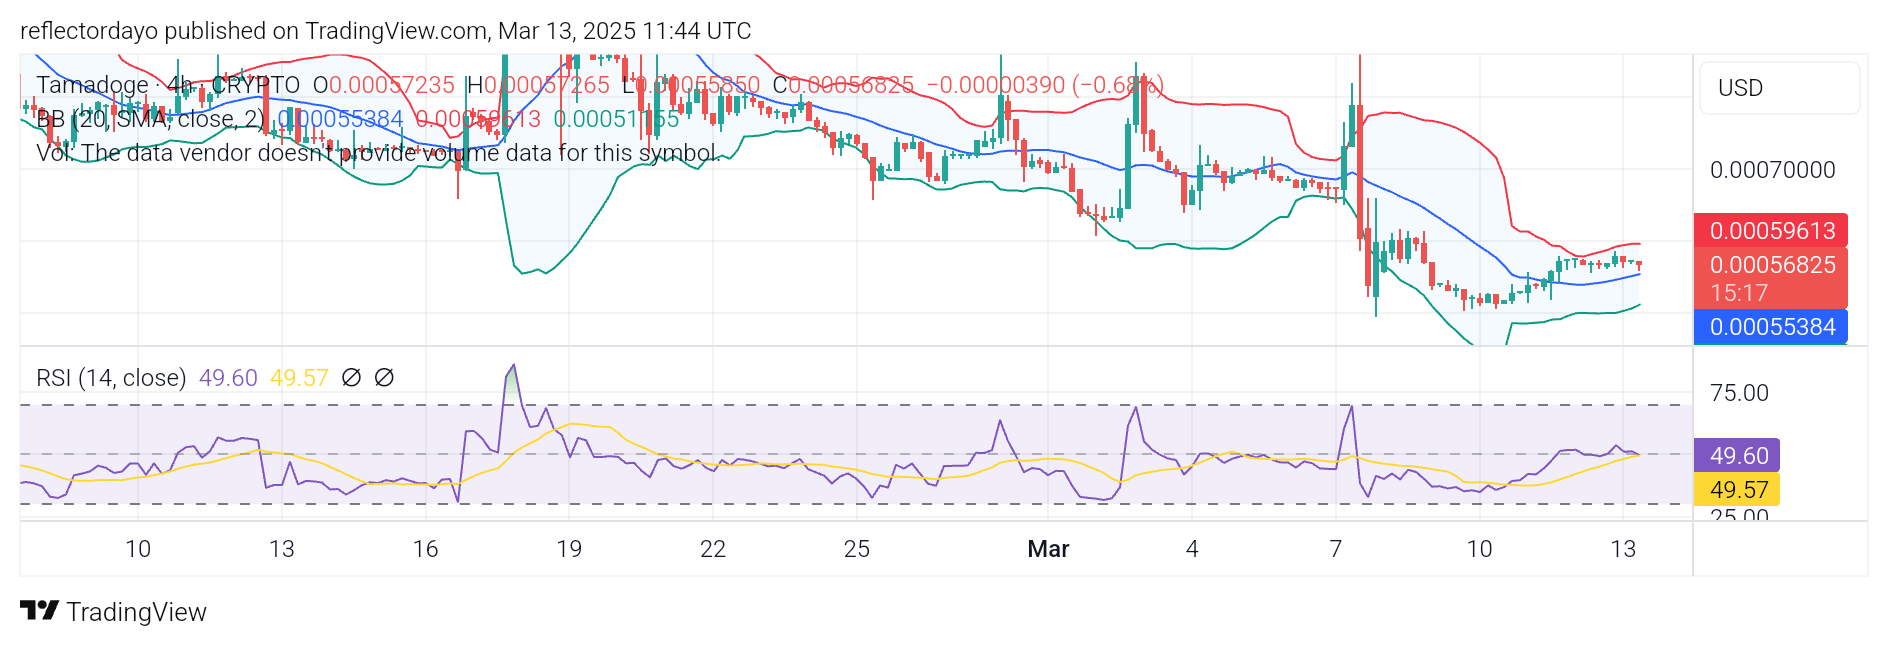
Currently, from an indicator perspective, the Tamadoge market appears to be in a state of equilibrium, with the price hovering around the $0.00056 level. The Relative Strength Index (RSI) is moving along the 50 mark, signaling neutral momentum, while the Bollinger Bands show the price slightly above the 20-day moving average.
As the moving average trends upward in an attempt to align with the horizontal price movement, the market itself is consolidating. This crypto signal suggests the potential formation of a consolidation phase around the $0.00055 to $0.00056 range, as price action stabilizes within a narrow trading channel.
Tamadoge Short-Term Outlook: 1-Hour Chart Analysis
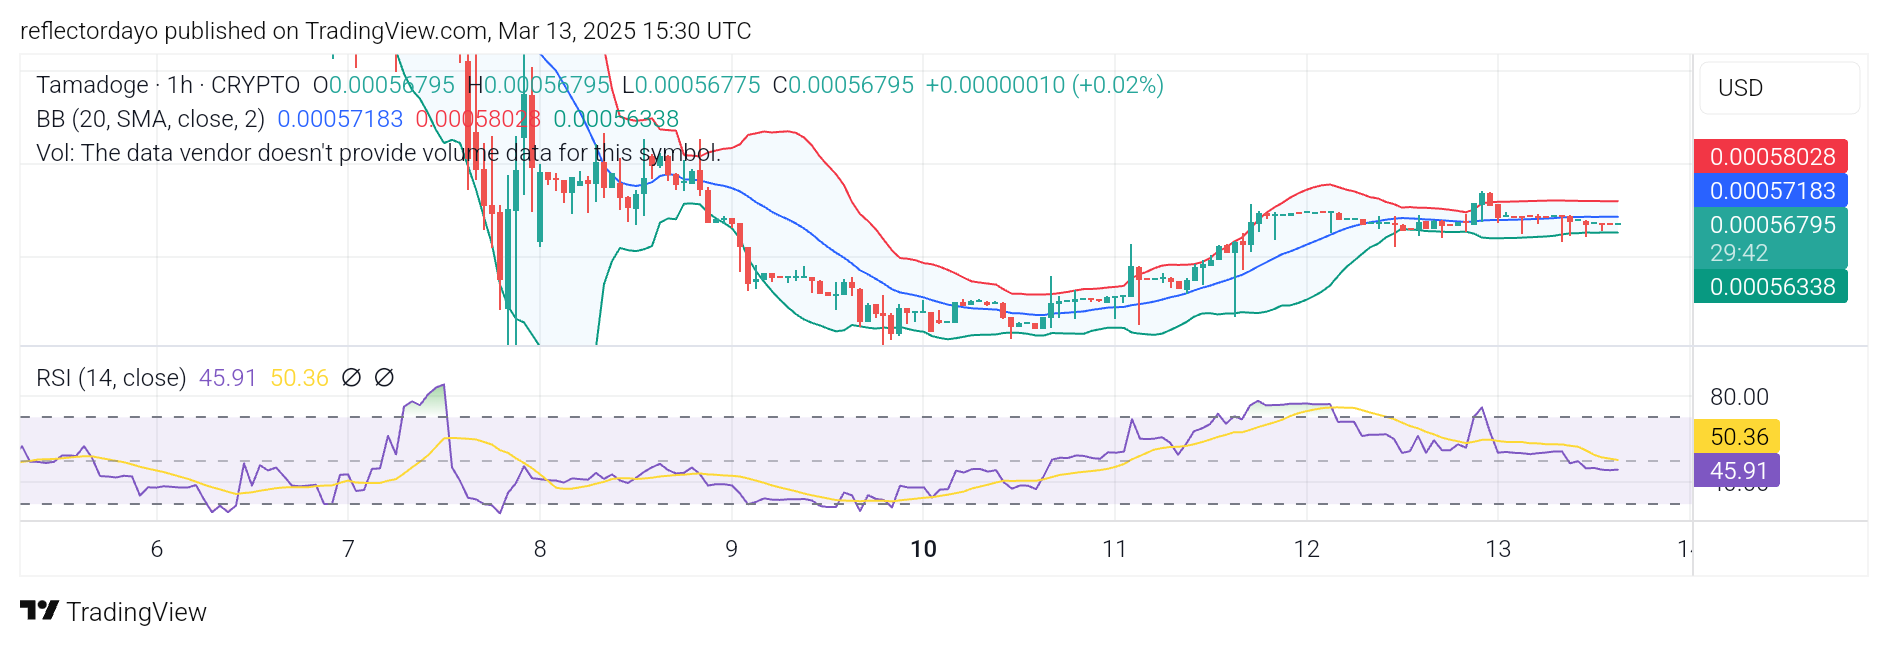
Zooming into a smaller timeframe, we can observe that the market holds the potential for a breakout. The key takeaway here is that price action continues to consolidate, maintaining a horizontal movement around the $0.00056 level.
However, within this consolidation phase, frequent lower shadows appear on candlesticks along the horizontal support line. This indicates strong bullish pressure below $0.00056, as sellers repeatedly fail to push the price lower. The consistent rejection of bearish attempts at this level reinforces it as a support zone, increasing the likelihood of an eventual breakout to the upside.
Fill your weekend by playing five exhilarating play-to-earn arcade games! 🕹️💰
Battle your way to the top of the weekly leaderboards and load up on $TAMA rewards!
Download on mobile now 👇
📱 Android: https://t.co/D4TjX7gTFl
📱 iOS: https://t.co/0fjJapf5oA pic.twitter.com/6MCruiKcet— TAMADOGE (@Tamadogecoin) September 13, 2024