Tamadoge (TAMA/USD): Demand vs. Supply Below $0.001 – A Potential Dip-Buying Opportunity?
Estimated Reading Time: 3 minutes
Don’t invest unless you’re prepared to lose all the money you invest. This is a high-risk investment and you are unlikely to be protected if something goes wrong. Take 2 minutes to learn more
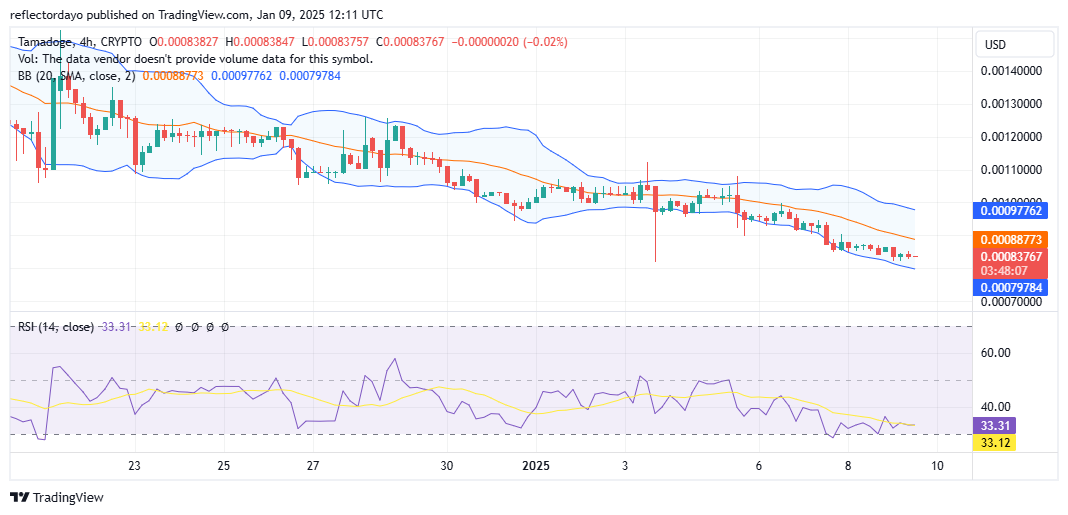
The ongoing battle between TAMA/USD buyers and sellers has intensified following a plunge below the critical $0.001 support level. On January 5th, the bears took control, driving prices further downward. After reaching a low of $0.000857, the bulls managed to find solid footing, temporarily halting the sharp decline.
Despite this brief stabilization, the struggle continues, with bears seemingly maintaining the upper hand. The crypto signal has gradually slid to $0.000083, with bears pushing toward the $0.0008 threshold. There is potential for the bulls to regroup at this level, possibly triggering a breakout and reversing the bearish momentum.
Key Levels
- Resistance: $0.0018, $0.0019, and $0.0020
- Support: $0.001, $0.0009 and $0.0008
TAMA/USD Price Analysis: The Indicators’ Point of View
Although the TAMA/USD bears have managed to push the market below the previous support level of $0.000857, driving it down to the current price of $0.000083, the candlestick patterns suggest waning bearish momentum. The candlesticks feature smaller bodies, closely resembling dojis, which often indicate indecision in the market.
While the bears successfully breached the $0.000857 support, their struggle near the $0.0008 price level suggests the presence of a strong bullish bias in this zone. Notably, the current trading session has formed a four-price doji, a potential indication that the bearish trend may be reaching its peak at $0.000083.
If this interpretation holds, a rebound or bounce from this level could be imminent, signaling a potential shift in market direction.
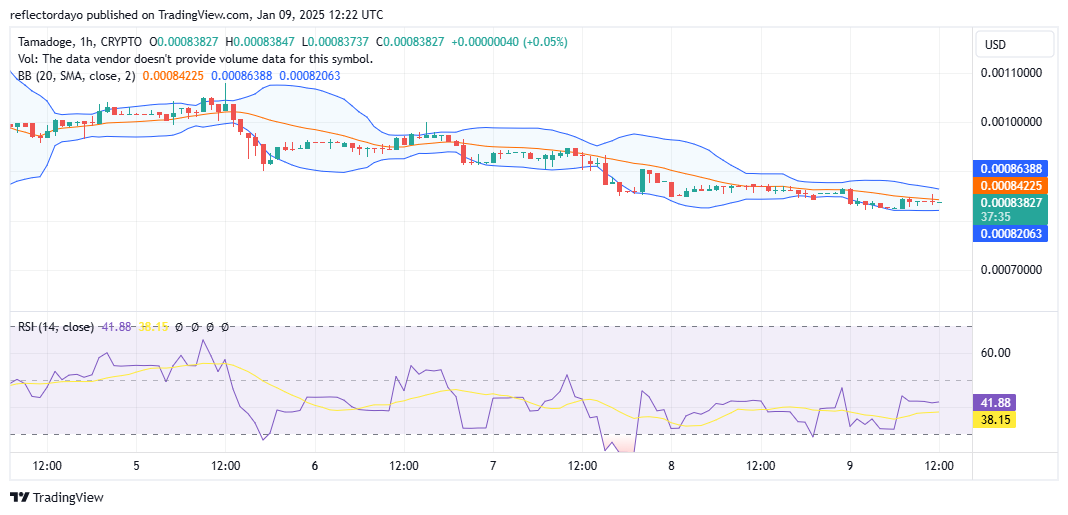
Tamadoge Short-Term Outlook: 1-Hour Chart
A closer look at a smaller timeframe reveals a flatter market, accompanied by the convergence of the Bollinger Bands around this price action. This phenomenon suggests that the market may be consolidating in preparation for a potential bounce, as the bearish trend appears to have encountered significant resistance near the $0.0008 price level.
Traders may find this level worth considering for investment, but only after confirming clear signs of a rebound. If a rebound does occur at this point, the market could potentially aim for the $0.001 price level as its next target.
Buy Tamadoge!
Fill your weekend by playing five exhilarating play-to-earn arcade games! 🕹️💰
Battle your way to the top of the weekly leaderboards and load up on $TAMA rewards!
Download on mobile now 👇
📱 Android: https://t.co/D4TjX7gTFl
📱 iOS: https://t.co/0fjJapf5oA pic.twitter.com/6MCruiKcet— TAMADOGE (@Tamadogecoin) September 13, 2024