Tamadoge (TAMA/USD) Market Shifts, Finds Support Near $0.001
Estimated Reading Time: 3 minutes
Don’t invest unless you’re prepared to lose all the money you invest. This is a high-risk investment and you are unlikely to be protected if something goes wrong. Take 2 minutes to learn more
Following a period of sideways consolidation below the $0.001 level, the TAMA/USD market experienced a significant shift. A new support level emerged near $0.00096, marking a change in market dynamics.
This development was preceded by a sudden surge in price action. Bulls capitalized on this brief upward momentum, pushing the price to a peak of $0.00127. While this spike in volatility presented both opportunities and risks, buyers were able to establish a stronger support base at $0.00096.
Key Levels
- Resistance: $0.0013, $0.0014, and $0.0015
- Support: $0.0008, $0.00078 and $0.00074
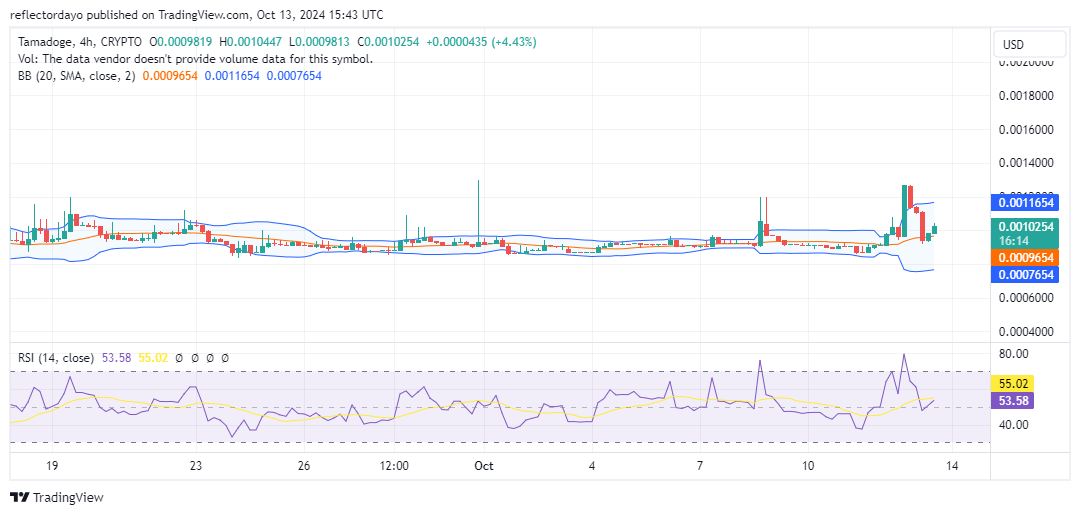
TAMA/USD Price Analysis: The Indicators’ Point of View
Yesterday, the TAMA/USD market demonstrated a positive shift, gaining bullish momentum and approaching the $0.00123 resistance level. While profit-taking activity led to a temporary pullback, the market exhibited sufficient bullish strength to rebound near the $0.00095 support level.
If buyers can maintain control, the $0.001 resistance level may face increased pressure. A successful break above this level could potentially lead to a retest of the $0.00126 high achieved during yesterday’s trading session.
Technical analysis of this crypto signal, such as the Relative Strength Index (RSI), indicates a bullish advantage. With the RSI currently above the 50 level, there is a possibility of continued upward momentum in the coming trading sessions.
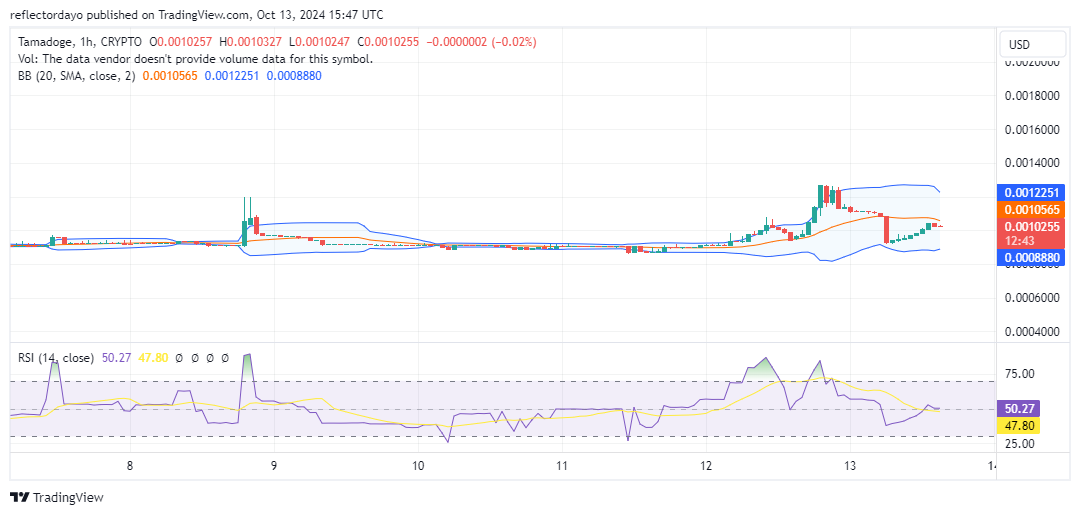
Tamadoge Short-Term Outlook: 1-Hour Chart
A closer examination of the 1-hour chart reveals a developing resistance level slightly above the $0.0010 mark. This could pose a challenge to the ongoing upward price movement.
However, the recent formation of a doji candlestick pattern suggests that bullish momentum may persist. Traders may choose to observe the market’s behavior in the next trading session before making definitive decisions.
The Bollinger Bands indicator continues to highlight significant market volatility, emphasizing the need for caution and careful analysis.
Buy Tamadoge!
Fill your weekend by playing five exhilarating play-to-earn arcade games! 🕹️💰
Battle your way to the top of the weekly leaderboards and load up on $TAMA rewards!
Download on mobile now 👇
📱 Android: https://t.co/D4TjX7gTFl
📱 iOS: https://t.co/0fjJapf5oA pic.twitter.com/6MCruiKcet— TAMADOGE (@Tamadogecoin) September 13, 2024