Tamadoge (TAMA/USD) Nears Breakout Threshold
Estimated Reading Time: 3 minutes
Don’t invest unless you’re prepared to lose all the money you invest. This is a high-risk investment and you are unlikely to be protected if something goes wrong. Take 2 minutes to learn more

Tamadoge (TAMA) has been consolidating in a narrow trading range for an extended period. Despite repeated attempts by bulls to break through the key resistance level, the price has remained relatively stable. While this may be somewhat discouraging for investors, it’s important to note that the market’s downside potential appears limited. Historically, the bulls have demonstrated a strong commitment to defending the $0.00085 support level, consistently rejecting bearish pressure at this threshold. However, the bulls have been unable to sustain a sustained rally in recent times as well.
Key Levels
- Resistance: $0.013, $0.014, and $0.015
- Support: $0.0008, $0.00078 and $0.00074
TAMA/USD Price Analysis: The Indicators’ Point of View
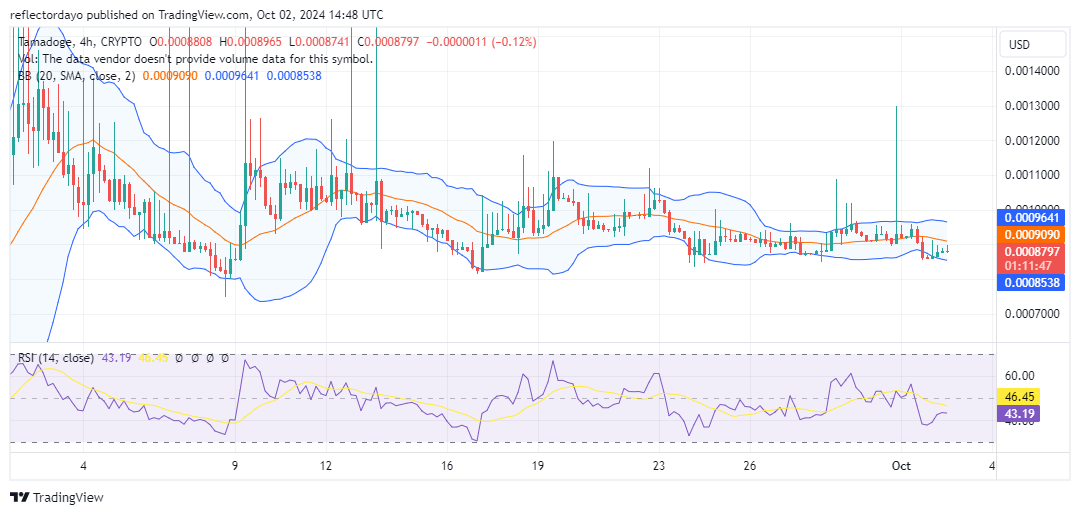
The market is currently in a state of indecision. While Tamadoge bulls maintain a firm hold on the $0.00085 support level, they lack the strength to drive the price significantly higher. This crypto signal suggests that the market may be accumulating near this support, potentially setting the stage for a future breakout if buying pressure intensifies.
Although the $0.001 level remains a formidable barrier for bulls, there are indications that a bullish breakout may be imminent. The market’s persistent attempts to push above this resistance, despite the absence of a successful breakdown at the $0.00085 support, suggest a growing bullish sentiment. A successful breach of the $0.001 level could signal the beginning of a significant uptrend.
Tamadoge Short-Term Outlook: 1-Hour Chart
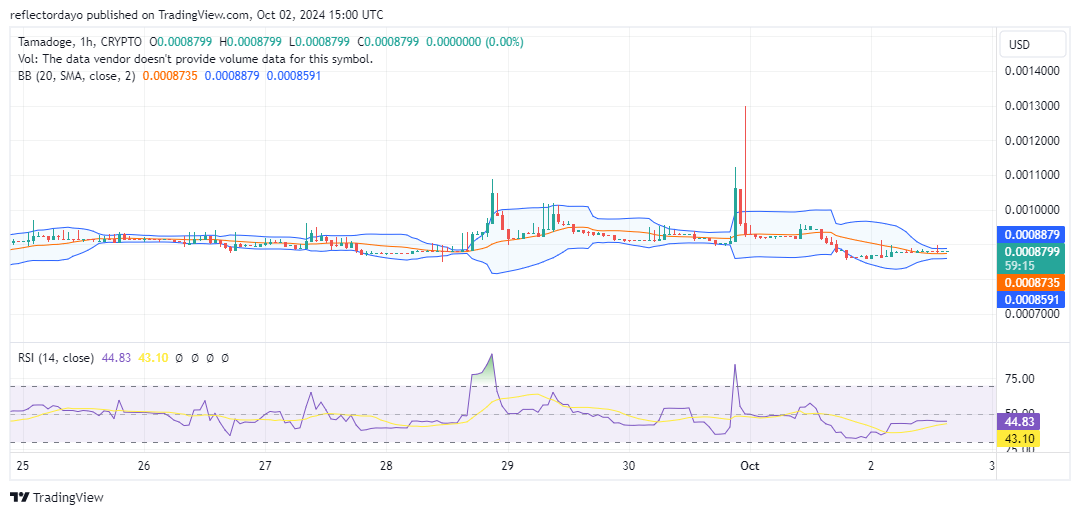
Zooming in on the 1-hour chart, we observe a newly formed resistance level at $0.0009. This indicates that bearish forces remain active in the market, particularly given the proximity of this resistance to the critical $0.00085 support level. However, the Bollinger Bands indicator has converged into a narrow range around the horizontally consolidating price action at $0.00088. This suggests that a breakout may be imminent, and given the bulls’ continued hold on the $0.00085 support, an upward breakout is more likely.
Buy TAMA/USD!
Fill your weekend by playing five exhilarating play-to-earn arcade games! 🕹️💰
Battle your way to the top of the weekly leaderboards and load up on $TAMA rewards!
Download on mobile now 👇
📱 Android: https://t.co/D4TjX7gTFl
📱 iOS: https://t.co/0fjJapf5oA pic.twitter.com/6MCruiKcet— TAMADOGE (@Tamadogecoin) September 13, 2024