Tamadoge (TAMA) Teeters on the Brink of a Breakout
Estimated Reading Time: 3 minutes
Don’t invest unless you’re prepared to lose all the money you invest. This is a high-risk investment and you are unlikely to be protected if something goes wrong. Take 2 minutes to learn more
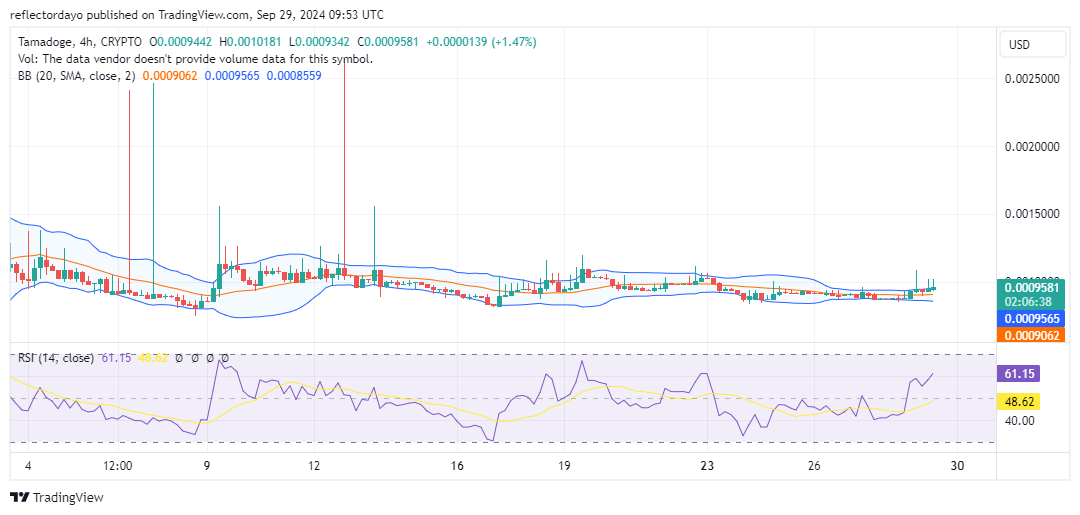
The TAMA/USD has been consolidating within a narrow trading range just below the $0.001 level for some time. The 4-hour chart reveals several attempts by the bulls to break through this key resistance, despite the tight price channel.
While the price continues to encounter resistance near $0.001, there are signs that buyers are struggling to overcome the prevailing bearish sentiment. The repeated testing of the $0.001 level suggests that the bulls are building momentum for a potential breakout. If the market successfully breaks above this level, it could signal the continuation of a bullish trend.
Key Levels
- Resistance: $0.013, $0.014, and $0.015
- Support: $0.0008, $0.00078 and $0.00074
TAMA/USD Price Analysis: The Indicators’ Point of View
Analyzing the 4-hour chart of the TAMA/USD market from a broader perspective, we can see that the bearish momentum has been quite strong. However, the bulls have done an impressive job of preventing the price from falling below the $0.001 level. With the frequent attempts to push the price above this key resistance, the crypto signal appears to be positioning itself for a potential upward trend.
This may be an opportune time for new investors to enter the bullish market, as the prolonged consolidation phase could be setting the stage for a significant breakout. The current support level at $0.0008 has effectively held, allowing the market to build momentum toward a breakout above the $0.001 level.
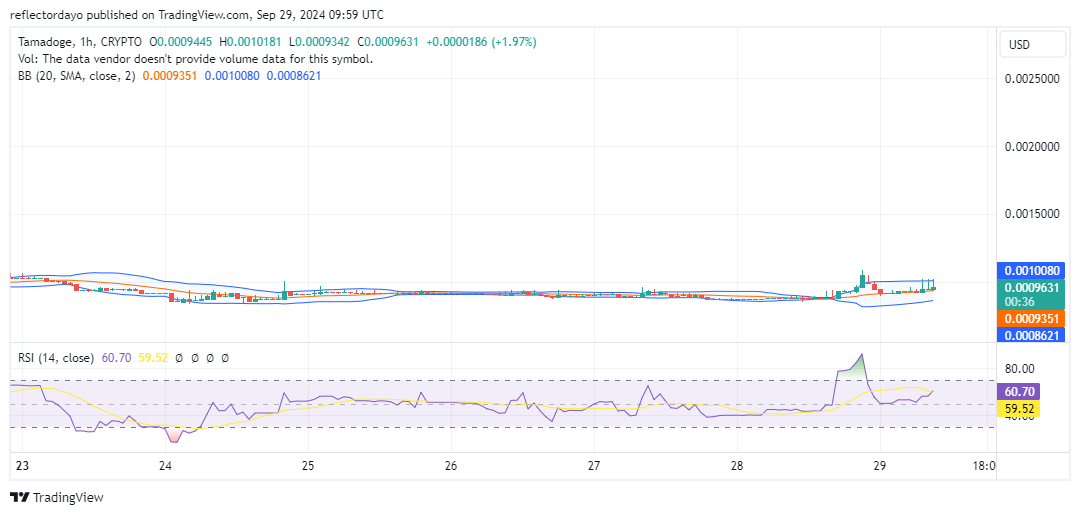
Tamadoge Short-Term Outlook: 1-Hour Chart
The 1-hour chart indicates that the market is correcting toward the $0.001 level after remaining stable around the $0.00091 price level, which coincides with the 20-day moving average. The market has established further support at this level and is now aiming to break through the $0.001 mark.
Due to this significant development, the Bollinger Bands indicator has begun to reflect an upward-trending price channel. Tamadoge (TAMA) appears poised for a breakout, as the resilience of the bulls, combined with key technical indicators, suggests a likely upward move. Investors should closely monitor the price action for signs of a potential rally.
Buy Tamadoge!
Fill your weekend by playing five exhilarating play-to-earn arcade games! 🕹️💰
Battle your way to the top of the weekly leaderboards and load up on $TAMA rewards!
Download on mobile now 👇
📱 Android: https://t.co/D4TjX7gTFl
📱 iOS: https://t.co/0fjJapf5oA pic.twitter.com/6MCruiKcet— TAMADOGE (@Tamadogecoin) September 13, 2024