Tamadoge (TAMA/USD) Persists Within a Horizontal Price Channel, Exploring Potential for Price Rally
Estimated Reading Time: 3 minutes
Don’t invest unless you’re prepared to lose all the money you invest. This is a high-risk investment and you are unlikely to be protected if something goes wrong. Take 2 minutes to learn more
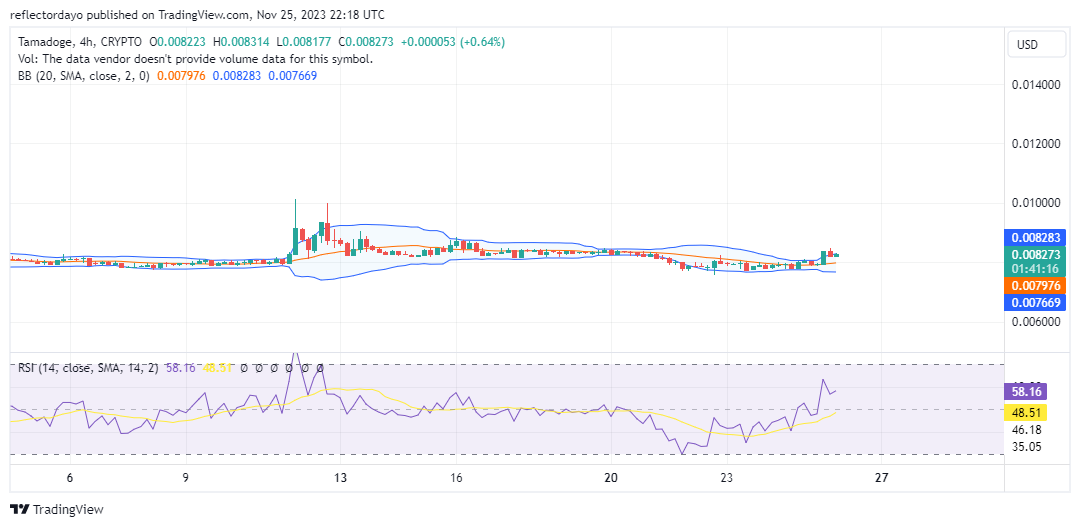
The interaction between Tamadoge’s supply and demand commenced in early October, centered around the $0.0008 price level, and has endured to the present moment. Although the TAMA/USD bull market briefly exceeded this threshold at one juncture, both bulls and bears currently contend in the vicinity of the pivotal $0.0008 price level.
Key Levels
- Resistance: $0.013, $0.014, and $0.015.
- Support: $0.0075, $0.0073, and $0.007.
TAMA/USD Price Analysis: The Indicators’ Point of View
Owing to the prolonged struggle between demand and supply at this level, the potential for a substantial TAMA/USD bullish breakout from the $0.0008 price level appears likely, albeit encountering formidable resistance at a key level. The protracted period of price consolidation holds the potential to solidify $0.0008 as a robust support level, facilitating a significant bullish upswing. This significance is underscored by the historical role of this level as a foundational support during the preceding bear market. The Bollinger Bands indicator reflects low market volatility, contributing to the challenge faced by buyers in breaking the market out of its current consolidation trend.
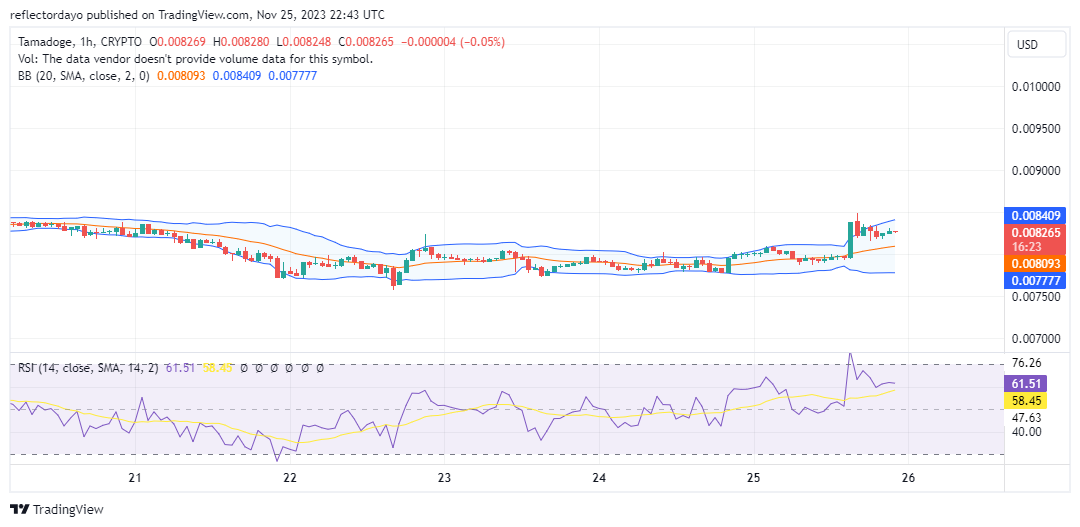
Tamadoge Short-Term Outlook: 1-Hour Chart
Upon analysis of the 1-hour chart, it is observed that bears are prematurely converging around the $0.00084 level, indicating an attempt to curtail the bull market at this point. Despite this, bullish traders exhibit resilience by maintaining pressure on this resistance. The upper standard deviation underscores the determination of the bullish sentiment, although the actual price action has plateaued around the resistance level. Notably, the Relative Strength Index remains at 61, reflecting a modest momentum in favor of the bulls. This suggests that despite the current impasse, the bulls still retain an advantageous position and may potentially propel the market beyond the $0.000084 limit.
Make $TAMA using any of our games, and then use our staking platform (http://tamadoge.io/buy-tokens) to invest your earnings.
✅ Play
✅ Earn
✅ StakeEarn $TAMA playing any of our games and then put your winnings to work using our staking platform 👉 https://t.co/Qa1cAZ5Qyh pic.twitter.com/Qr7U2Z3nG0
— TAMADOGE (@Tamadogecoin) November 22, 2023
Do you want a coin that will be 100 times more valuable in the next few months? That is Tamadoge. Buy TAMA today!