Tamadoge (TAMA/USD) Primed for Bullish Momentum: Anticipated Restart at $0.0070 with Potential Surge Beyond $0.012
Estimated Reading Time: 3 minutes
Don’t invest unless you’re prepared to lose all the money you invest. This is a high-risk investment and you are unlikely to be protected if something goes wrong. Take 2 minutes to learn more
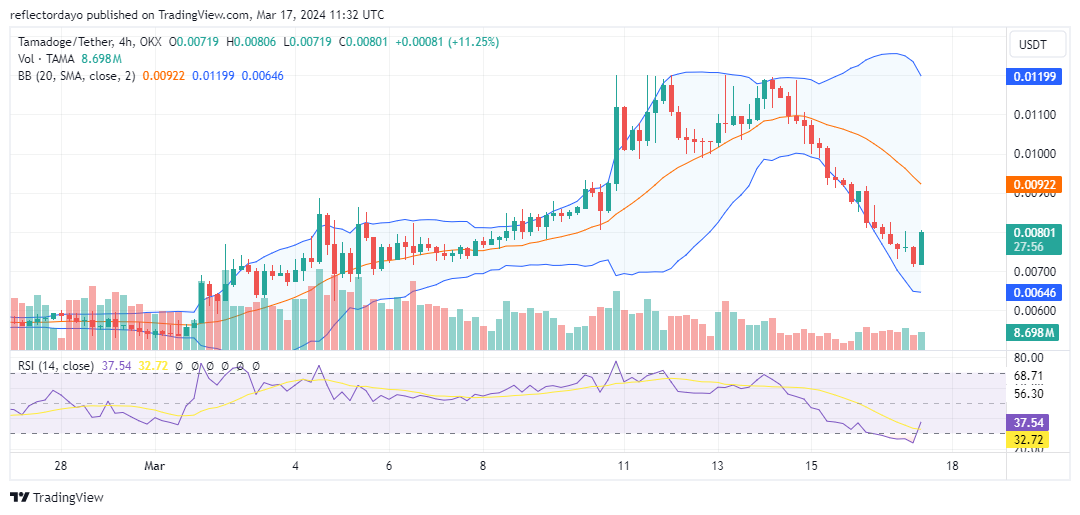
The $0.012 price level has served as a formidable resistance barrier in the TAMA/USD market since March 10. On March 14, a bear market was initiated, precipitating a significant market downturn. However, the $0.007 price level has demonstrated robust support, suggesting the potential for a substantial bullish trend to emerge from this level. Consequently, this presents an opportune moment for traders to consider buying, as the market has recommenced its upward price trajectory.
Key Levels
- Resistance: $0.013, $0.014, and $0.015.
- Support: $0.0045, $0.0040, and $0.0035.
TAMA/USD Price Analysis: The Indicators’ Point of View
Presently, the ongoing 4-hour session is defined by a robust candlestick pattern, signaling strong bullish market sentiment. Bullish momentum has driven the price to the $0.008 level. Although, according to the crypto signal from the 4-hour chart, some resistance may be anticipated at this juncture, the compelling outlook of the candlestick for the current trading session implies that overcoming resistance at this level could be achieved with relative ease. Moreover, the heightened volatility indicated by the Bollinger Bands reinforces expectations for a pronounced price rally. This increased volatility provides an opportunity for bulls to leverage market conditions, potentially propelling the price to higher levels and establishing a stronger support base.
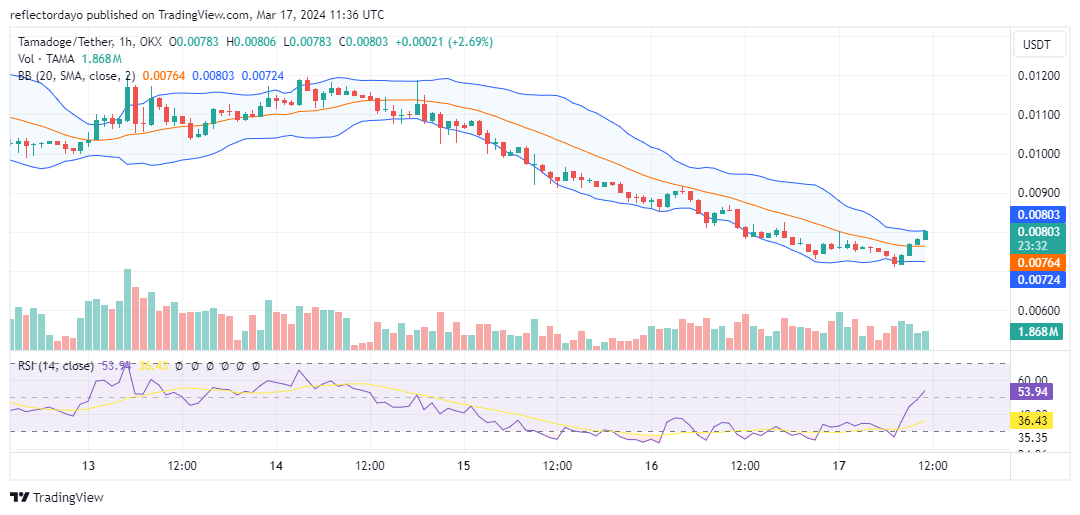
Tamadoge Short-Term Outlook: 1-Hour Chart
Upon examination of the 1-hour chart of the TAMA/USD market, a notable trend has emerged, with the market exhibiting bullish behavior over three consecutive trading sessions. This significant market shift is starting to influence overall market direction, as evidenced by the price surpassing the 20-day moving average. Furthermore, the RSI (Relative Strength Index) line, after ascending from oversold territory, has surpassed the 50 level. Additionally, the RSI’s trajectory indicates the potential for further bullish price movement.
Buy Tamadoge
The Tamaverse is now on @0xPolygon
💎 Low gas fees to claim $TAMA prizes
💎 Low gas fees to level up your NFTs
💎 Low gas fees to stake your earningsPlay and earn more on Tamadoge Arena now 👇
📱 Android: https://t.co/INCaGendE4
📱 iOS: https://t.co/Fj9tT5Oicu pic.twitter.com/hUw4FX4sag— TAMADOGE (@Tamadogecoin) February 9, 2024
Do you want a coin that will be 100 times more valuable in the next few months? That is Tamadoge. Buy TAMA today!