Tamadoge (TAMA/USD) Regains Momentum as Bullish Volatility Intensifies
Estimated Reading Time: 3 minutes
Don’t invest unless you’re prepared to lose all the money you invest. This is a high-risk investment and you are unlikely to be protected if something goes wrong. Take 2 minutes to learn more
Recent market analysis indicated that Tamadoge was gradually advancing toward the $0.00045 price level after establishing support around $0.0004. However, the market has since experienced heightened volatility, driven by sharp price oscillations, which has made TAMA/USD more prone to significant and frequent swings.
Despite the volatility, bullish sentiment has gained traction, with the price now edging closer to the $0.00046 mark. This resurgence in upward momentum suggests that buyers are beginning to assert control, potentially paving the way for further gains if resistance levels are breached.
Key Levels of Interest
- Resistance: $0.00045, $0.00050, $0.00055
- Support: $0.00041, $0.00040, $0.00035
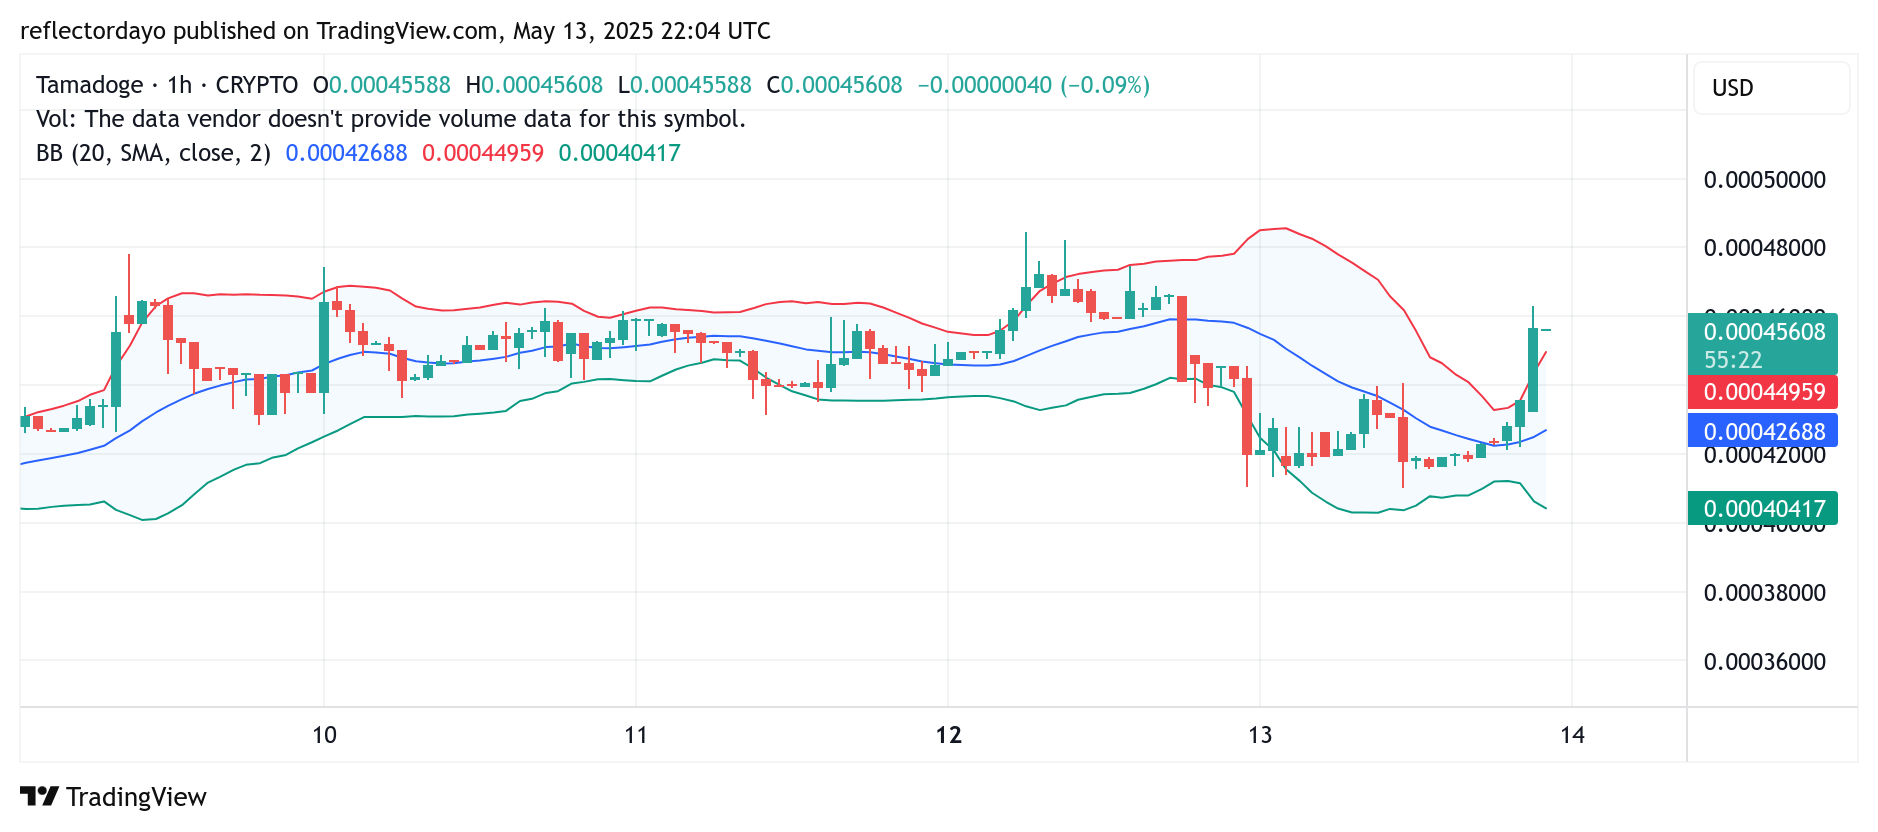
Tamadoge (TAMA/USD) Technical Analysis: Bullish Momentum Builds as Support Shifts Higher
The technical indicators continue to reflect a bullish outlook for TAMA/USD. A notable development is the upward shift in the support level—from $0.0004 to $0.00042—signaling growing strength among buyers and sustained bullish activity in the market.
In the current trading session, a strong bullish candlestick underscores this sentiment, indicating clear dominance by the bulls. While a brief wave of profit-taking occurred as the price touched the $0.00046 level, bearish pressure remains minimal. This setup suggests a healthy uptrend with potential for further gains if bullish momentum persists.
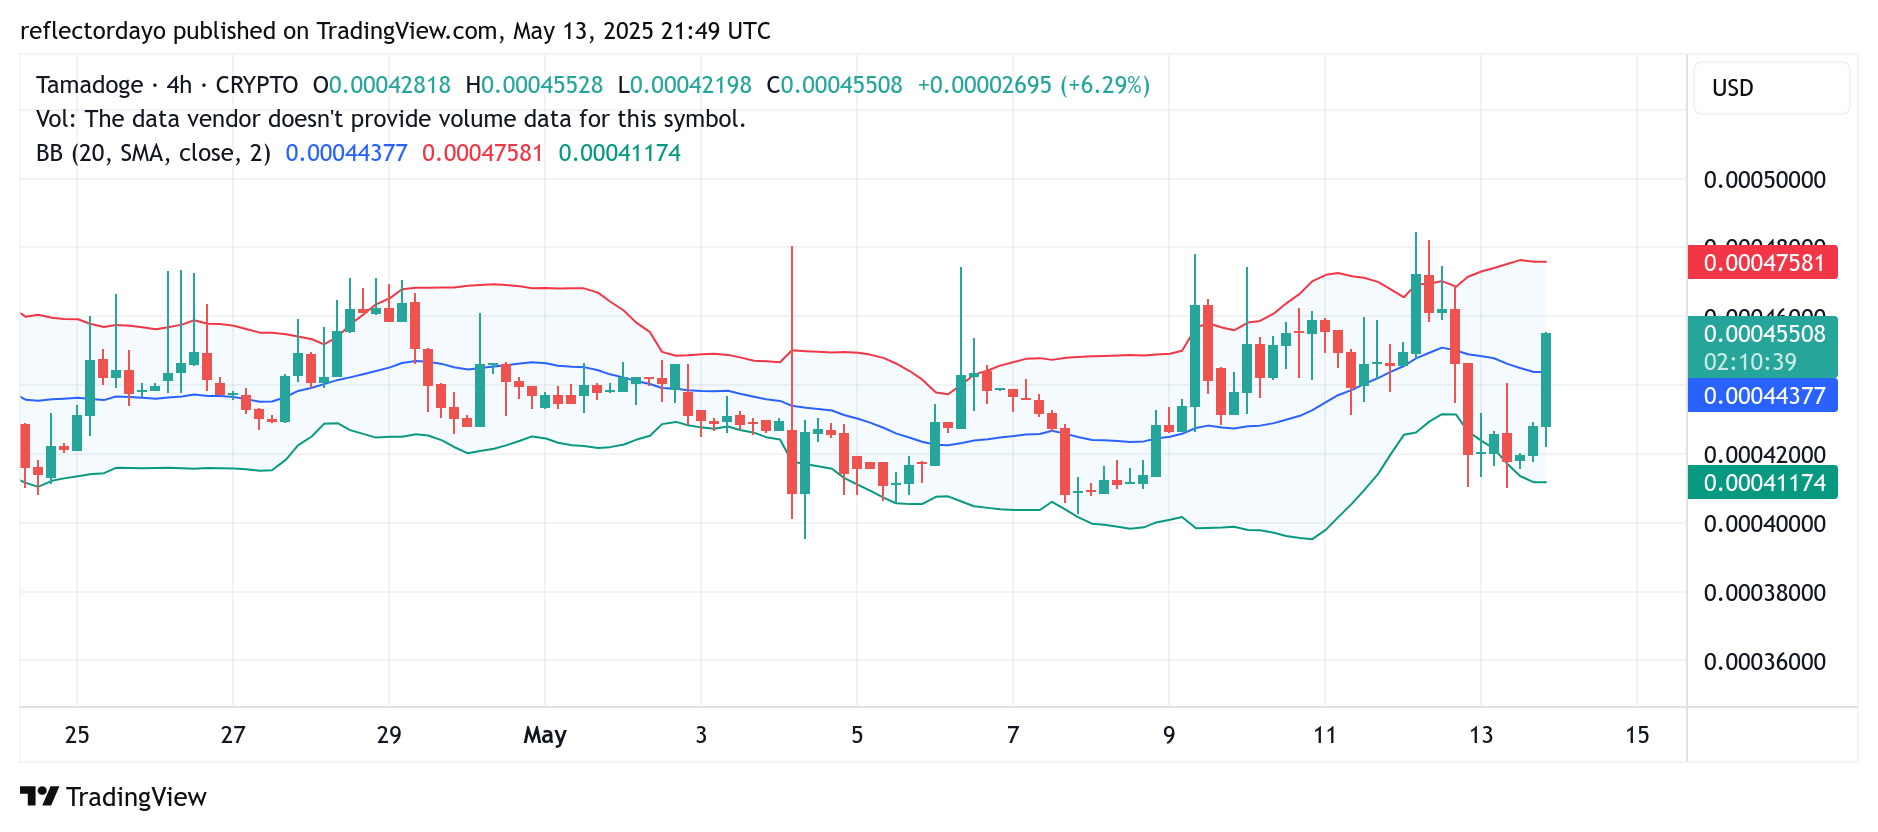
Tamadoge (TAMA/USD) 4-Hour Chart: Bulls Attempt to Hold Ground Near $0.000456 Amid Signs of Correction
Analyzing the TAMA/USD market from the 4-hour chart perspective, bullish resilience remains evident near the $0.00046 price level. This crypto signal is reflected in the formation of a four-price doji in the current session, signaling indecision but also highlighting the ongoing tug-of-war between buyers and sellers.
The previous session revealed a mild correction after the price touched the $0.00046 resistance. However, the presence of the doji suggests that bullish sentiment has not entirely faded, with buyers attempting to establish support around the $0.000456 level.
Notably, the price recently broke above the upper band of the Bollinger Bands—an indicator of an overbought condition. This points to the likelihood of continued correction in the short term. Should the price fall below $0.000456, traders may look to the $0.00045 level as the next potential reentry zone for bullish positions.
Buy Tamadoge!
There’s no mobile runner out there quite like #TamadogePursuit! 🏃♂️
1️⃣ Sign up – start with 20 free credits for a boost!
2️⃣ Climb up the leaderboards.
3️⃣ Win $TAMA rewards!Play Now! 👇
📱Android: https://t.co/Of8SYALRzL
📱 iOS: https://t.co/IthvqovwAH pic.twitter.com/84HNqob9Rf— TAMADOGE (@Tamadogecoin) September 10, 2024