Tamadoge (TAMA/USD) Still Holding Steady at $0.001
Estimated Reading Time: 3 minutes
Don’t invest unless you’re prepared to lose all the money you invest. This is a high-risk investment and you are unlikely to be protected if something goes wrong. Take 2 minutes to learn more
After a significant surge in Tamadoge, pushing the market to $0.00127, volatility has increased. While heightened volatility typically offers bears an opportunity to drive the market in their favor, the emergence of the $0.001 price level as a support highlights the strength and resilience of the bulls. The bulls’ intervention at this level has firmly established it as a strong support, leading to the current sideways movement in the market. Given the bulls’ demonstrated strength, there is a possibility that the market may rally towards the previous high of $0.00127.
Key Levels
- Resistance: $0.0013, $0.0014, and $0.0015
- Support: $0.0008, $0.00078 and $0.00074
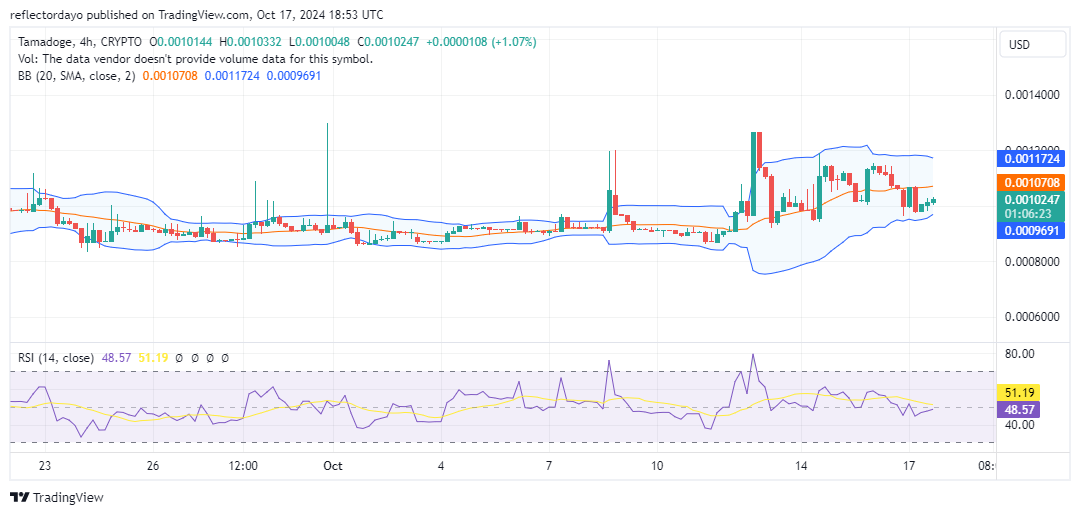
TAMA/USD Price Analysis: The Indicators’ Point of View
The indicators are signaling the resilience of the bulls at the key $0.001 price level, despite the bearish pressure triggered at $0.00127. Although the market peaks are descending, the support at $0.001 has held firm, reflecting the strength of the bulls. With demand stabilizing at this level, market volatility has decreased, as evidenced by the convergence of the Bollinger Bands. This convergence suggests that the market may be preparing for a bounce, potentially rallying toward $0.00127 and possibly establishing a higher support level as it moves upward.
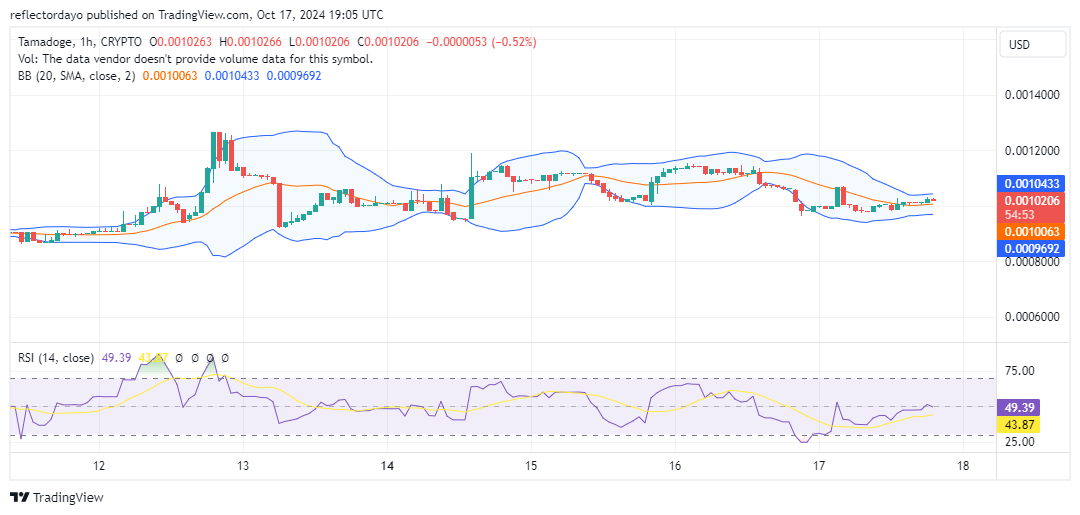
Tamadoge Short-Term Outlook: 1-Hour Chart
The 1-hour chart for Tamadoge aligns with the crypto signal of the 4-hour chart, confirming the overall market outlook. Here too, the descending peaks are evident, while the $0.001 price level consistently holds strong, rejecting bearish attempts. Recently, the Bollinger Bands have converged into a narrow range, closely reflecting the current price channel, with the price remaining steady at $0.001. This convergence suggests that the market is gearing up for a significant move, potentially rallying towards $0.00127.
Buy TAMA/USD!
Fill your weekend by playing five exhilarating play-to-earn arcade games! 🕹️💰
Battle your way to the top of the weekly leaderboards and load up on $TAMA rewards!
Download on mobile now 👇
📱 Android: https://t.co/D4TjX7gTFl
📱 iOS: https://t.co/0fjJapf5oA pic.twitter.com/6MCruiKcet— TAMADOGE (@Tamadogecoin) September 13, 2024