Tellor (TRB/USD) Reclaims $30.00 Amidst Bullish Recovery, Defends Key Support
Estimated Reading Time: 3 minutes
Don’t invest unless you’re prepared to lose all the money you invest. This is a high-risk investment and you are unlikely to be protected if something goes wrong. Take 2 minutes to learn more
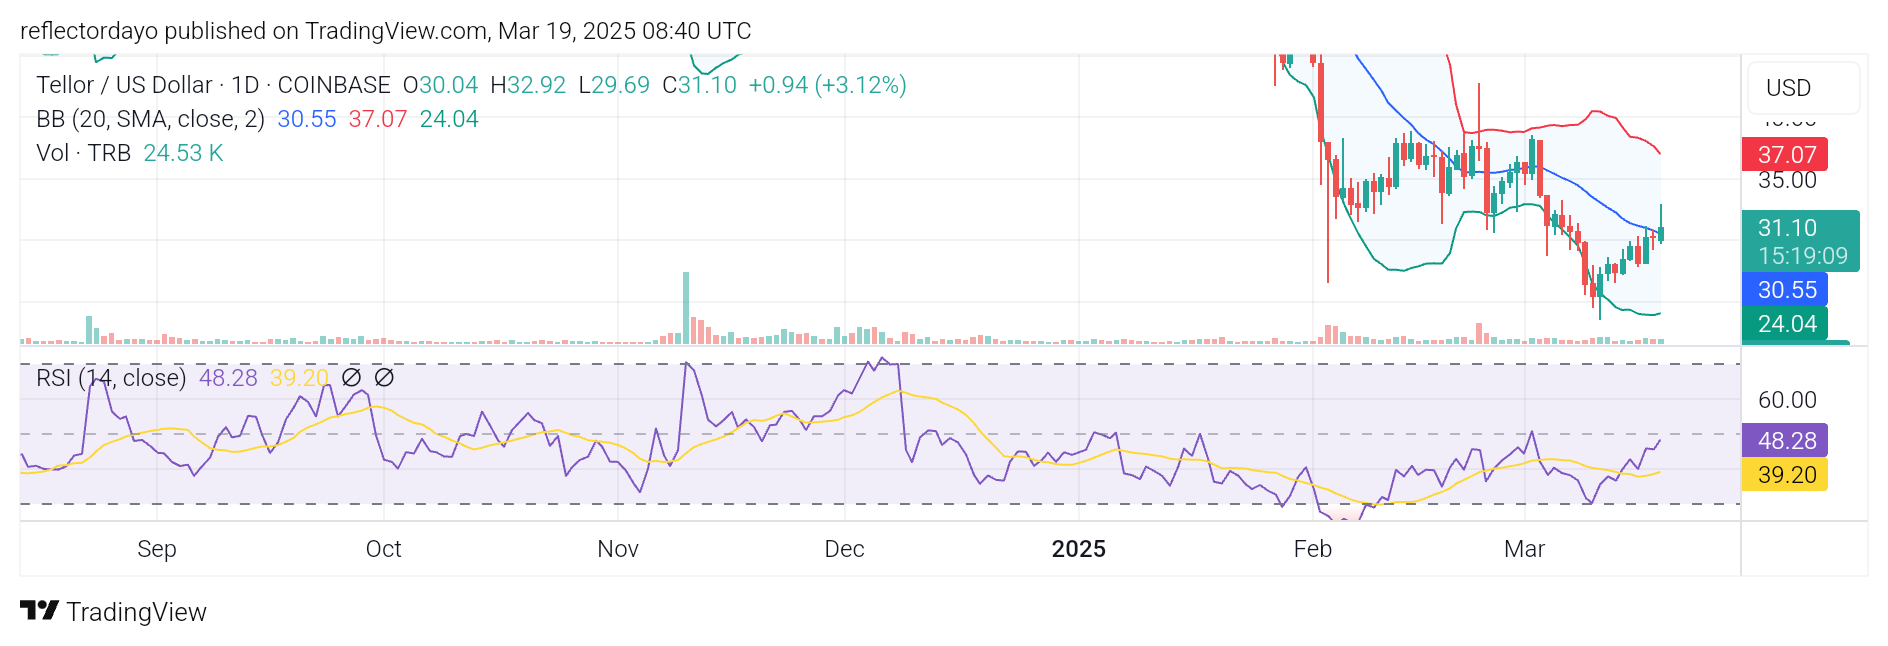
The Tellor market recently established a strong and pivotal support level in the lower price zones, specifically at $23.5. This support level served as a foundation for a bullish recovery, driving the price upward. Currently, the price has surged above this critical level and is attempting to defend it.
Following the breakout, price action is now contending with bearish resistance, as evidenced by the substantial upper shadow on today’s candlestick. The key question remains: Can the bulls overcome this resistance? Let’s analyze the technical indicators for potential insights.
Tellor Market Data
- TRB/USD Price Now: $30.81
- TRB/USD Market Cap: $81.6 million
- TRB/USD Circulating Supply: 2.6 million TRB
- TRB/USD Total Supply: 2.7 million TRB
- TRB/USD CoinMarketCap Ranking: #373
Key Levels
- Resistance: $35.00, $40.00, and $45.00
- Support: $25.00 $20.00, and $15.00
Tellor Through the Lens of Indicators
Tellor has recently recovered from a prolonged bearish trend, with a pivotal bounce occurring on March 11. Before this recovery, the market experienced heightened downward volatility, including a brief but intense selling phase that further spiked market fluctuations. Bullish traders seized this opportunity, initiating strong buying activity around the $23.5 level, which triggered a swift price rebound.
Now, with the market successfully breaking above $30.00, traders are exercising caution, and some have started taking profits. This crypto signal, combined with residual bearish pressure from the previous downtrend, has created significant resistance to the ongoing recovery. However, the market is not yet in overbought territory. Despite a notable increase in volatility, the Relative Strength Index (RSI) has only just reached the midpoint, indicating that there is still room for further upward movement.
If demand continues to balance with supply at this level, price action may consolidate before the next potential surge.
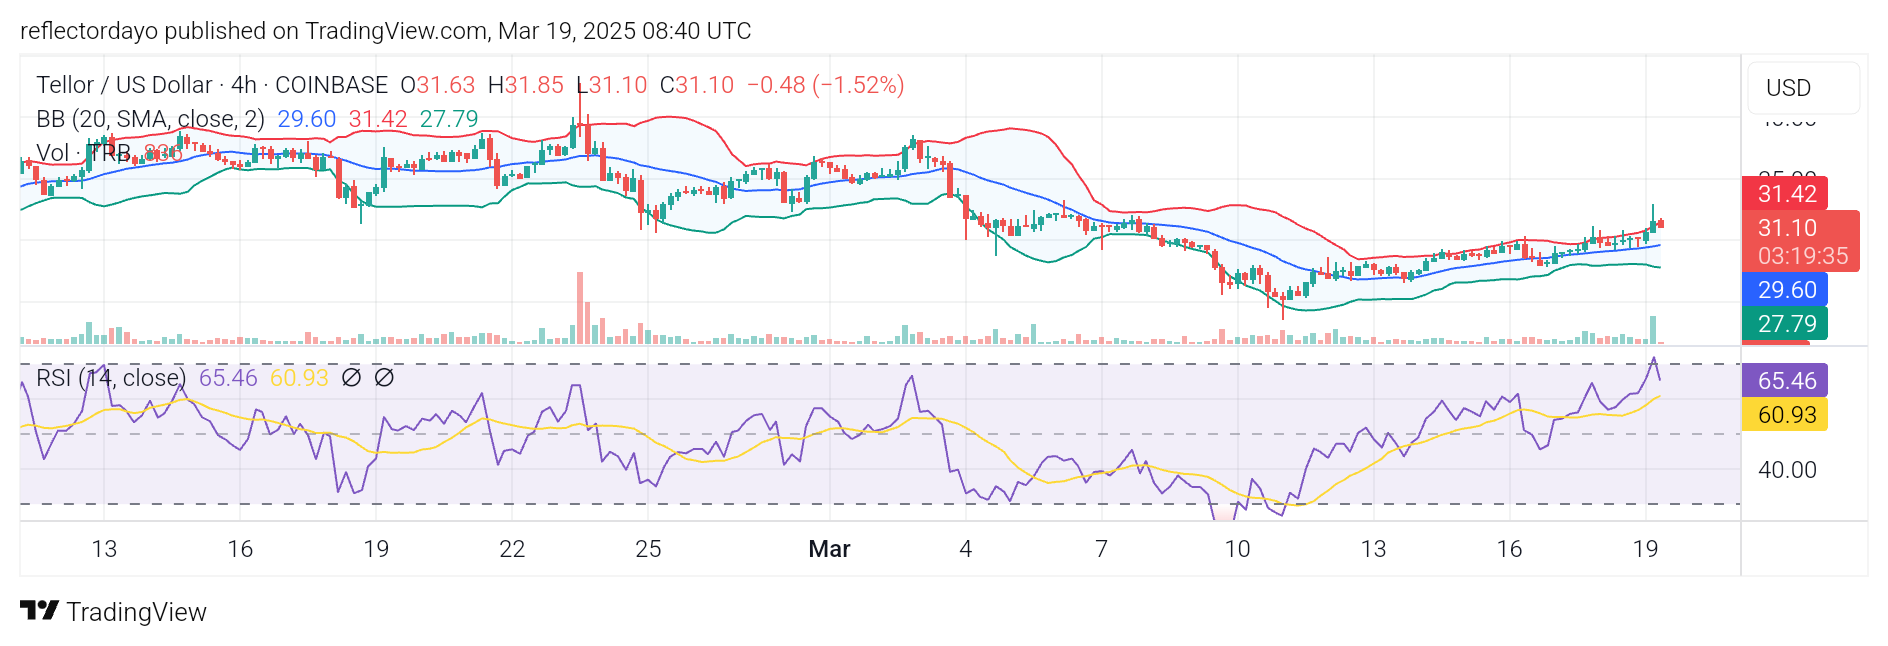
TRB/USD Price Prediction: 4-Hour Chart Analysis
Zooming into the 4-hour chart, we can see that the market is undergoing a price correction, which began after the price peaked at $33.00. Currently, the price is approaching the $30.00 level, where some traders may be anticipating a buying opportunity. Many are likely monitoring this level closely, with buy orders already set in place.
A bounce from this level would further solidify $30.00 as a strong support, potentially sustaining the ongoing bullish recovery. However, if the price breaks below this level, bulls may regroup at the critical $23.5 support zone—the point where the previous bearish run was halted.