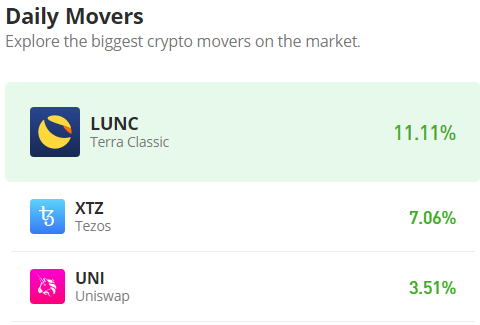
Tezos (XTZ/USD) Sparks Massive Buying in the $0.7 Demand Zone
Estimated Reading Time: 3 minutes
Don’t invest unless you’re prepared to lose all the money you invest. This is a high-risk investment and you are unlikely to be protected if something goes wrong. Take 2 minutes to learn more
After the Tezos market peaked at the year’s high of $1.49 on February 23, it could be said that bears became a bit stronger. This was because every attempt made by the Tezos bull market to rally back to $1.49 has only resulted in lower highs since then. However, bulls have been so formidable that, due to their strong presence in the market since February 23, the market is just completing a full bearish cycle. Tezos bulls slowed down the bearish progress.
Tezos Market Data
- XTZ/USD Price Now: $0.774
- XTZ/USD Market Cap: $78,262,119
- XTZ/USD Circulating Supply: 941,504,650 XTZ
- XTZ/USD Total Supply: 962,690,093
- XTZ/USD Coinmarketcap Ranking: #52
Key Levels
- Resistance: $0.80, $0.90, and $1.00
- Support: $0.65, $0.50, and $0.45
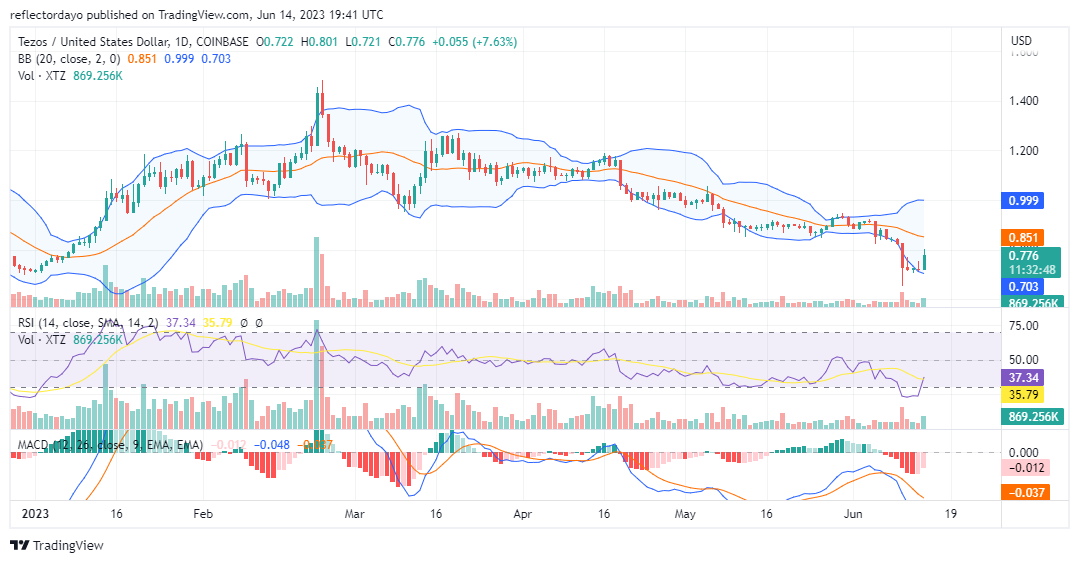
Price Prediction for the XTZ Market: The Indicators’ Point of View
The $0.713 price level is the key support level; it is the point at which the Tezos bullish cycle started early this year before it peaked at the $1.49 price level. Therefore, the market is expected to begin another bullish cycle from here. But probably the recent crisis in the crypto market may have forced the market to fall below the key support price level as traders were selling massively. However, in today’s market, we can see a sharp recovery from below the key support level, and the price of the market rises as bullish sentiment continues to grow. The Relative Strength Index (RSI) also portrays the market rising in an almost vertical fashion from below the 30.00 level, which is the border line between the oversold territory and the sell zone. This illustrates bullish aggression. However, a major concern is that the volume of trade indicator did not have a histogram that is commensurate with the price activities of today’s market. This might indicate that bullish aggression may be cooling off.
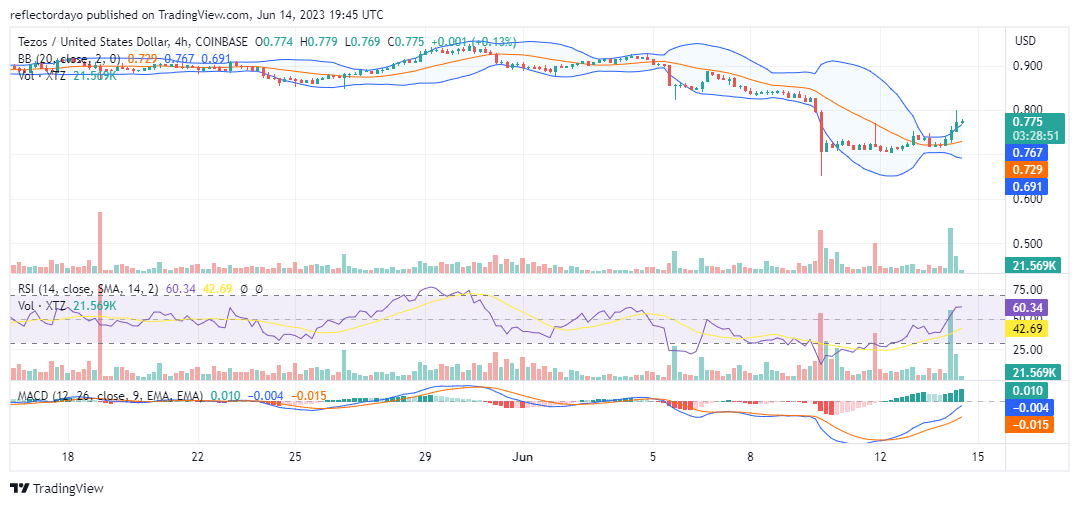
XTZ/USD 4-Hour Chart Outlook:
From this point of view, the market is clearly having a bullish price break out from the horizontal market that is moving along with the $0.717 price level, and as illustrated by the Bollinger Bands indicator, this new development is increasing the level of volatility in the market. This is good for the XTZ bulls, as high volatility increases the chance for the continuation of the bullish trend. However, as bulls continue to propel the market to the upside, they need to deal with resistance at the $0.800 price level.