The Aave Market (AAVE/USD) Bullish Signals Emerge, $100 Target in Sight
Estimated Reading Time: 2 minutes
Don’t invest unless you’re prepared to lose all the money you invest. This is a high-risk investment and you are unlikely to be protected if something goes wrong. Take 2 minutes to learn more
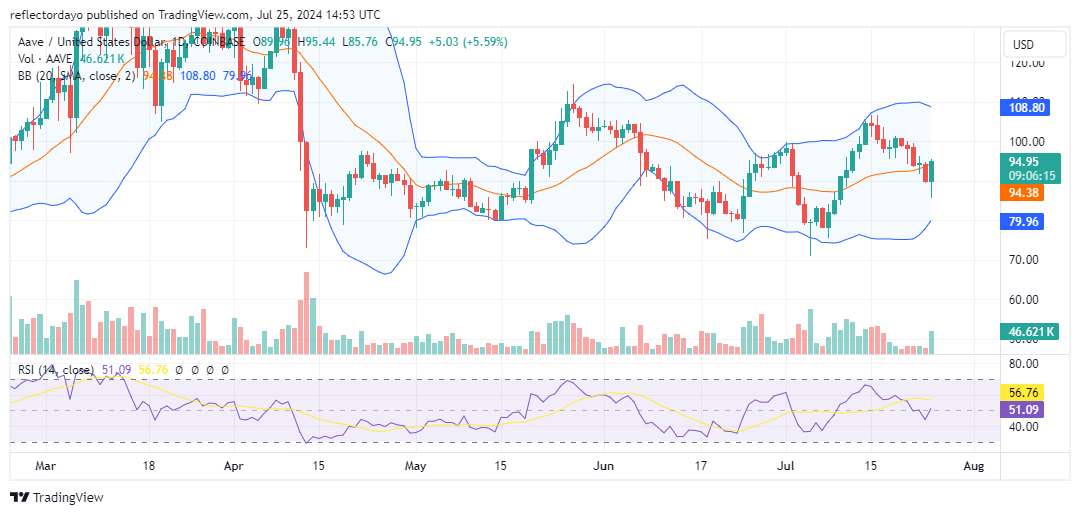
Recently, the Aave market has been quite volatile, fluctuating between $80 and $110. In mid-July, the market experienced a significant surge, breaking past the previous resistance level of $100. However, the bullish momentum peaked near $110 before the market began to decline. In today’s trading session, the market found solid support at $90. Bullish traders have seized this entry point and are driving the market back towards $100.
The Aave Market Data
- AAVE/USD Price Now: $95.21
- AAVE/USD Market Cap: $1.4 billion
- AAVE/USD Circulating Supply: 13 billion AAVE
- AAVE/USD Total Supply: 16 million
- AAVE/USD CoinMarketCap Ranking: #55
Key Levels
- Resistance: $110.00, $115.00, and $120.00
- Support: $90.00, $85.00, and $80.00.
Price Prediction for the Aave Market: The Indicators’ Point of View
Indicators are showing strong bullish crypto signals in the market, as depicted in today’s daily chart. Notably, the candlestick for today’s trading activities has a substantial lower shadow, indicating robust bullish activity below the $90 price level. The main body of the candlestick confirms strong trading activities. Furthermore, the trading volume indicator supports this price movement with a strong histogram. Additionally, the lower standard deviation curve of the Bollinger Bands is turning upward, responding to increased buying activities. Given the current market momentum, reaching the $100 price level seems imminent.
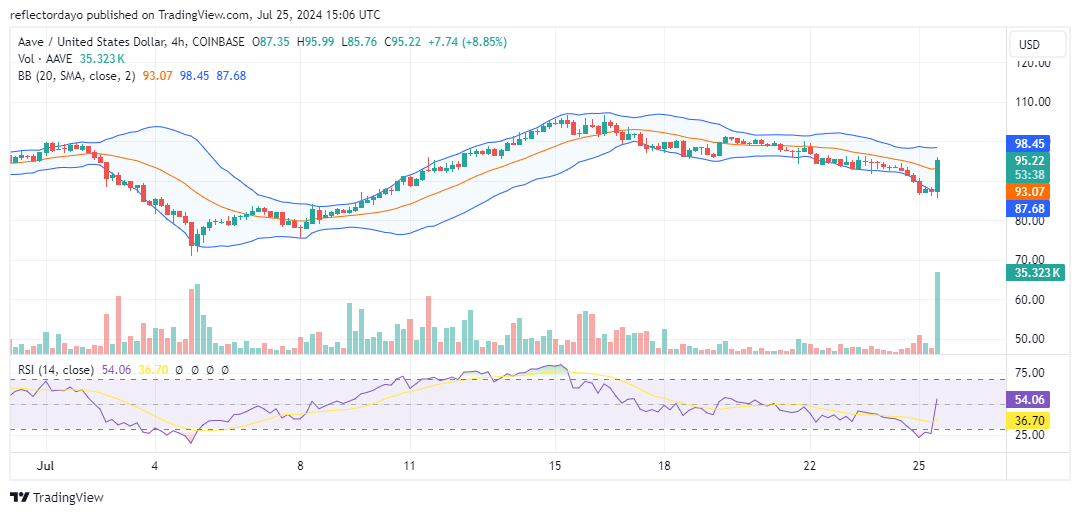
AAVE/USD 4-Hour Chart Outlook
The 4-hour chart provides further evidence of a bullish outlook for the Aave market, although it also indicates potential bearish outcomes. Initially, the market found solid support at $87, which halted the downtrend and was followed by a significant bullish surge towards $100. However, a concern arises regarding the possibility of a reversal. The Relative Strength Index (RSI) shows a near-vertical rise, suggesting hyper-bullishness that may be followed by hyper-bearishness as bearish traders could capitalize on market volatility. Traders should monitor higher support levels to ensure the market continues its upward trajectory.