The Aave Market (AAVE/USD) Seeks to be Established Above the $70 Mark
Estimated Reading Time: 3 minutes
Don’t invest unless you’re prepared to lose all the money you invest. This is a high-risk investment and you are unlikely to be protected if something goes wrong. Take 2 minutes to learn more
The Aave market has recently experienced a substantial surge in price, marked by higher lows occurring within a relatively short timeframe. This surge has been accompanied by a notable increase in market volatility.
On October 1st, the bullish momentum propelled the price to an impressive $70, although it was unable to sustain this level. Instead, a higher support level formed around $64, serving as a foundation for the ongoing upward retracement towards the key resistance level at $70. It is essential to note that the current bull market, which commenced on September 12, has significantly increased overall market volatility.
AAVE Market Data
- AAVE/USD Price Now: $69.79
- AAVE/USD Market Cap: $1.021,096,313
- AAVE/USD Circulating Supply: 14,580,202 AAVE
- AAVE/USD Total Supply: 16,000,000 AAVE
- AAVE/USD CoinMarketCap Ranking: #43
Key Levels
- Resistance: $72, $75, and $78.
- Support: $60, $57, and $55.
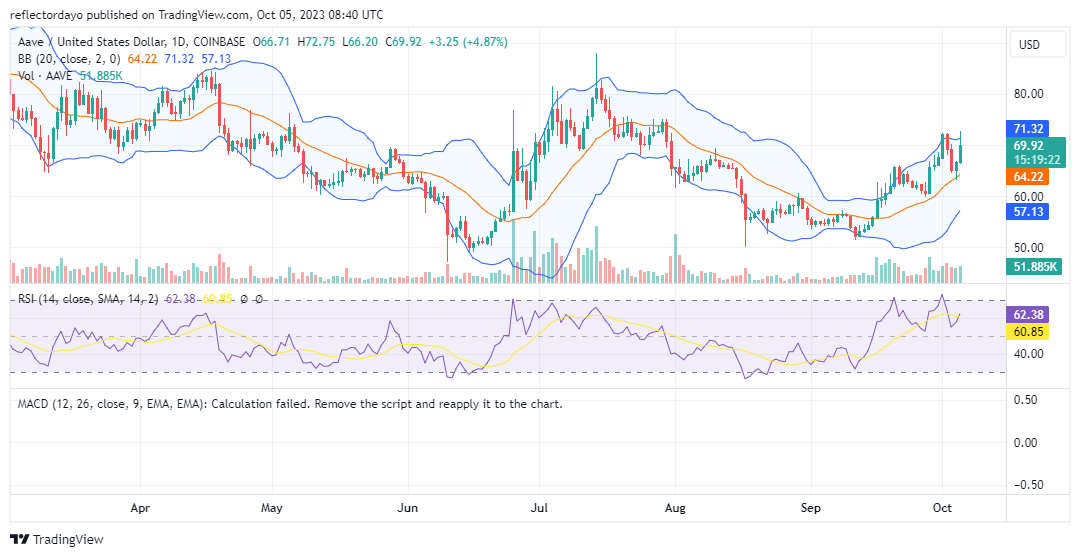
Price Prediction for the AAVE Market: The Indicators’ Point of View
The breakout above $70 showcased the Aave market‘s potential, but it wasn’t sustained. However, the formation of a higher support at $64 is a positive signal for bulls. The ongoing retracement to $70 indicates active buyers aiming to challenge the previous high.
Considering the current volatility and bullish performance, there’s potential for the market to surpass the $70 resistance, establishing support above it. Yet rapid price fluctuations signal market uncertainty. Traders should use caution and employ risk management strategies effectively.
The Relative Strength Index (RSI), a key momentum indicator, currently reads 61, indicating robust buying momentum even after the $70 retracement. However, be cautious, as an RSI above 70 could suggest overbought conditions and a possible pullback.
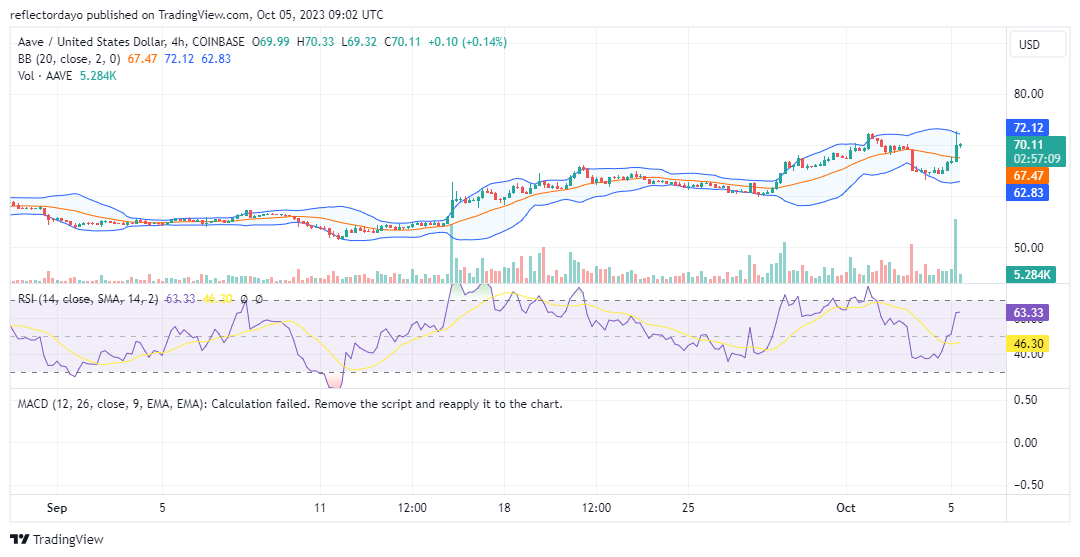
AAVE/USD 4-Hour Chart Outlook
The Relative Strength Index (RSI) readings on the 4-hour chart closely mirror those on the daily chart, with a momentum measurement of 62. This indicates a significant buying interest in the market. However, given the elevated level of volatility, both bullish and bearish forces are potent, resulting in rapid oscillations between demand and supply zones. Traders should exercise prudence when making buy or sell decisions. Presently, the bullish sentiment appears dominant, with an apparent aim to establish support around the $70 price range.