The Stacks Market (STX/USD) Hits a Wall at $2.27 After Surging Past Resistance
Estimated Reading Time: 3 minutes
Don’t invest unless you’re prepared to lose all the money you invest. This is a high-risk investment and you are unlikely to be protected if something goes wrong. Take 2 minutes to learn more
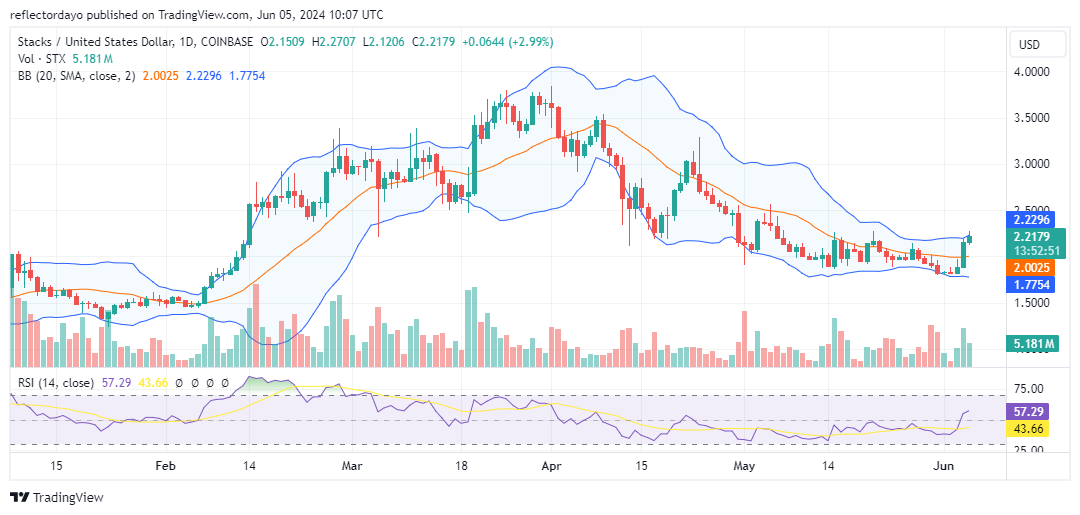
In yesterday’s analysis of the Stacks market, we noted the emergence of bullish sentiment at the $2.00 price level. The bulls stepped in at this level, intending to halt the market’s rollercoaster ride since early May, following the high of $3.90. The lower highs observed in the market since then indicate strong bearish momentum. However, the bullish intervention at the $2.00 level suggests an effort by the bulls to reverse the trend and push the market in an upward direction.
The Stacks Market Data
- STX/USD Price Now: $2.2
- STX/USD Market Cap: $3.2 billion
- STX/USD Circulating Supply: 1.4 billion STX
- STX/USD Total Supply: 1.8 billion STX
- STX/USD CoinMarketCap Ranking: #34
Key Levels
- Resistance: $2.30, $2.50, and $3.00
- Support: $1.80, $1.75, and $1.70.
The Stacks Market Through the Lens of Indicators
As of yesterday’s analysis, the Stacks market faced its first significant hurdle to establish a bullish course: the $2.00 price level. At that time, the price was below $2.00. However, by the end of the daily trading session, the price action had broken significantly above this level, closing around $2.15. Today’s trading session has continued from this point, targeting the next resistance level at $2.27. Further possible resistance levels are at $2.57 and $3.30. Currently, the market is facing immediate resistance at $2.27. The bulls remain in control during today’s trading session. Although the bullish candlestick is not as strong as expected, the substantial trading volume gives it credibility. The candlestick’s behavior suggests bearish sentiment is resisting the advancing bull market at this critical resistance level. Traders should focus on this level to observe market developments.

STX/USD Price Prediction: 4-Hour Chart Analysis
Considering the crypto signal from the perspective of the 4-hour chart, despite high trading activity indicated by the volume of trade, the price action is flattening at the $2.27 resistance level. This suggests the possibility of a market reversal. The bullish momentum may be reaching an exhaustion point, and the Relative Strength Index indicates an overbought condition, further supporting the likelihood of a market reversal. The bulls, for now, need renewed strength to keep the market going.