The Storj Market (STORJ/USD) Surges as Bulls Assert Dominance
Estimated Reading Time: 3 minutes
Don’t invest unless you’re prepared to lose all the money you invest. This is a high-risk investment and you are unlikely to be protected if something goes wrong. Take 2 minutes to learn more
The Storj market is currently experiencing an assertive bullish trend, leading to a significant surge in prices and breaking away from the indecision that persisted around the $0.74 price level since November 18. This strong bullish momentum has elicited a bearish response, with some traders opting to take profits as the market approaches $0.900.
While the bull market demonstrates strength, the intense bullish surge also carries the potential for a substantial bearish reversal that could diminish the previously gained bullish price levels. Nevertheless, if bullish traders can strategically intervene at a more favorable price level to establish a robust support level, the bullish momentum may persist, potentially reaching the $1.00 price mark.
The Storj Market Data
- STORJ/USD Price Now: $0.8338
- STORJ/USD Market Cap: $337,890,205
- STORJ/USD Circulating Supply: 382,350,349 STORJ
- STORJ/USD Total Supply: 424,999,998 STORJ
- STORJ/USD CoinMarketCap Ranking: #131
Key Levels
- Resistance: $0900, $0.950, and $1.000.
- Support: $0.750, $0.700, and $0.650.
The Storj Market Forecast: Analyzing the Indicators
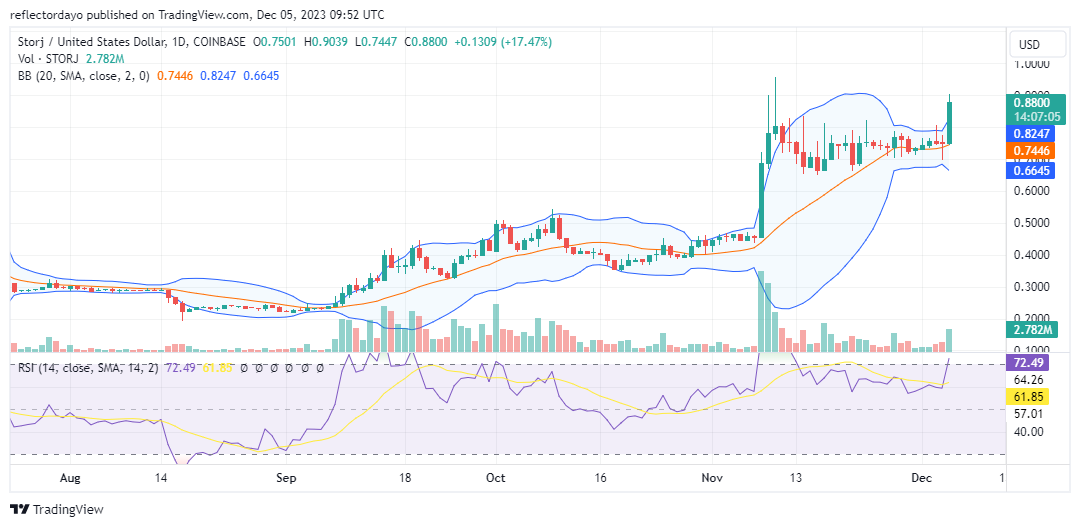
An exceptionally bullish price surge was observed on the chart on November 8, propelling the price from approximately $0.446. This surge successfully breached multiple resistance levels, eventually settling in the $0.700 and $0.800 price zones. Following a period of indecision in the Storj market around this range, the market has recently resumed its upward trajectory.
The Bollinger Bands exhibit divergence as the robust bullish movement triggers a bearish bias around the $0.900 price level. However, with the upper standard deviation displaying more pronounced upward divergence than the lower standard deviation, it indicates a clear bullish dominance in this market. The volume of trade indicator supports these market dynamics, with today’s trading activities represented by a significant histogram.
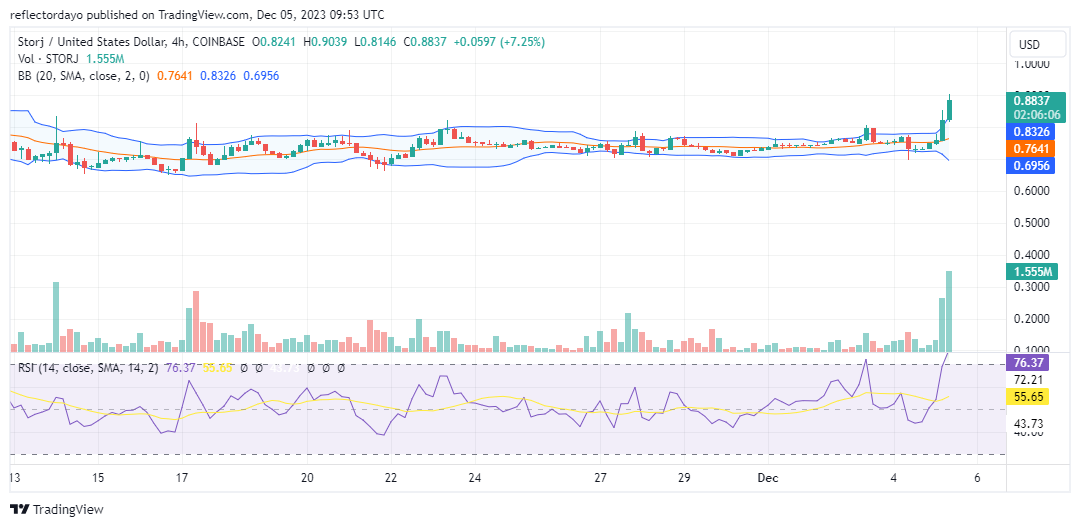
STORJ/USD 4-Hour Chart Outlook
Examining the 4-hour chart perspective, both the Bollinger Bands and the Relative Strength Index indicate an overbought market. The potential for a retracement looms, with traders interpreting this as a possible bearish signal. However, if bulls can establish a higher support level, there remains the possibility of sustaining the current trend.