Top Trending Coins for Today, December 17: BONK, RDNT, RATS, ICP, and SATS
Estimated Reading Time: 6 minutes
Don’t invest unless you’re prepared to lose all the money you invest. This is a high-risk investment and you are unlikely to be protected if something goes wrong. Take 2 minutes to learn more
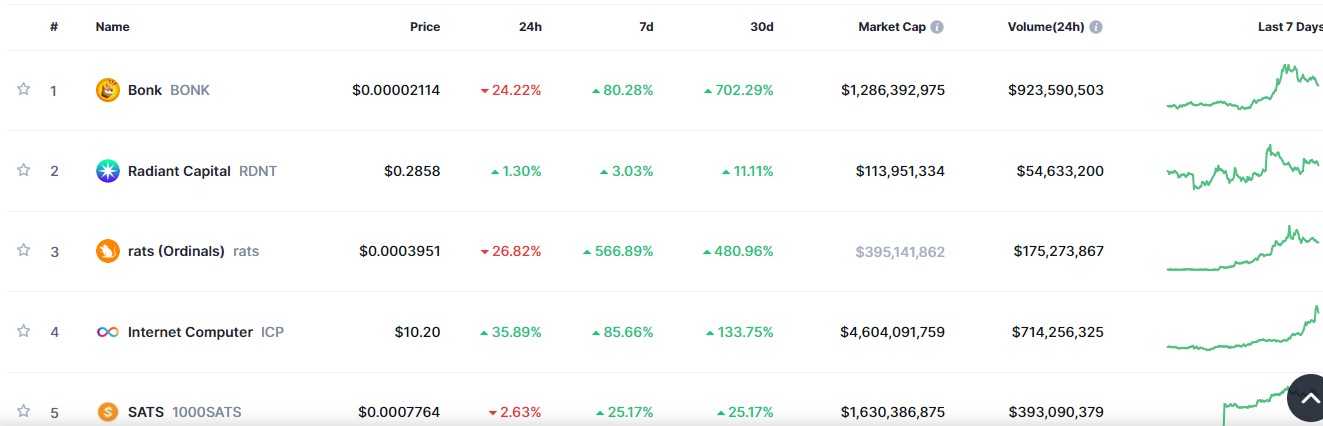
This week’s compilation highlights coins that have demonstrated notable gains in the market. The top five markets have witnessed a significant resurgence, with several outperforming stalwarts such as Bitcoin and Solana. Notably, the Bonk market, which was featured in last week’s compilation, has risen to the forefront, securing the top position. Its impressive performance reflects sustained momentum, establishing and maintaining its standing since the previous week.
Bonk (BONK)
Major Bias: Bearish
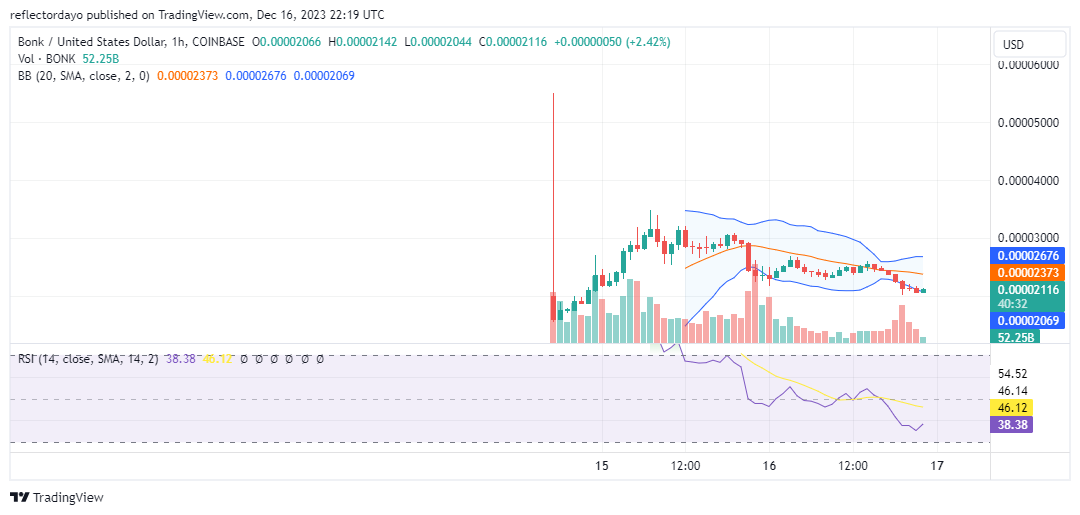
In the past 7 days, the market has demonstrated a noteworthy 80.28% increase, while over the last 30 days, an impressive gain of 702.29% has been recorded. This market, relatively new based on recent historical data reflected in the charts, experienced a substantial price swing during the week. On December 14th, the price fluctuated between $0.00001581 and $0.00005504, indicating substantial trading activity. The noteworthy aspect of this day lies in the significant profit-taking by traders when the market reached its daily high, leading to a considerable erosion in price, dipping below the $0.00002 level. The subsequent bull market commenced promptly from this point.
A lower high was established at $0.00003465, and since then, the price has been undergoing retracement. However, there are signs of a slowdown in the bear market, suggesting a potential shift. It is noteworthy that, from the $0.00002 threshold, another bull run may initiate soon.
Current Price: $0.00002122
Market Capitalization: $1,286,392,975
Trading Volume: $923.590,503
Radiant Capital (RDNT)
Major Bias: Bullish
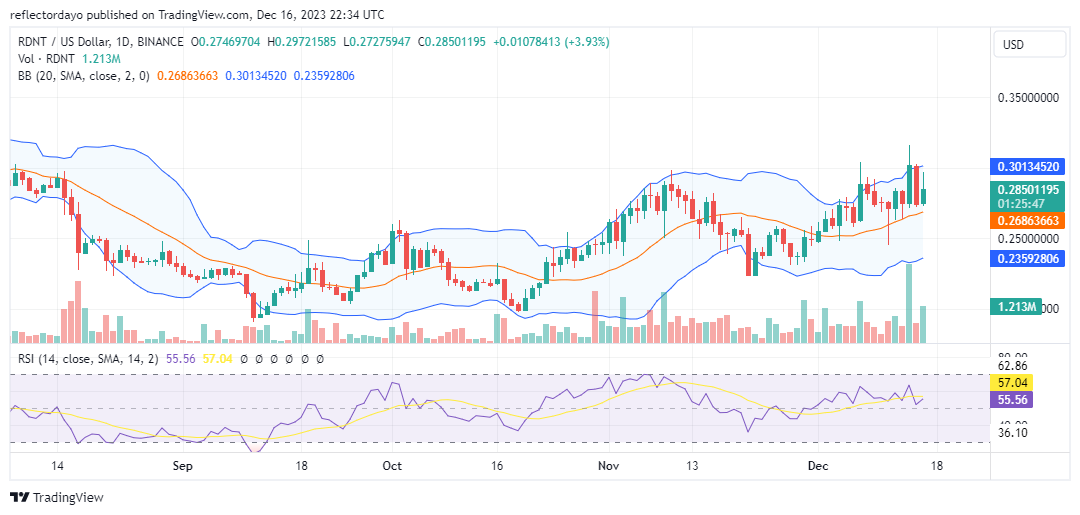
Securing the second position on this week’s list of high-performing markets is Radiant Capital. The market is evidently exhibiting a bullish trend, as evidenced by the formation of higher lows. The $0.200 price level has notably emerged as a key support level, serving as the foundation for the bullish trajectory initiated in October. The first higher low materialized at the $0.22 price level, following resistance encountered at $0.30.
Bulls strategically intervened at a higher price point, specifically $0.27, intensifying the pressure on the critical $0.30 resistance level. While certain upper shadows on recent candlesticks suggest bearish activities around $0.30, maintaining a strong position at $0.27 would enable bulls to overcome this resistance, paving the way for sustained bullish momentum. This strategic approach positions the market to capture $0.30 and perpetuate the ongoing bullish trend.
Current Price: $0.3013
Market Capitalization: $113,951,334
Trading Volume: $54,633,200
rats (Ordinals) (rats)
Major Bias: Bullish
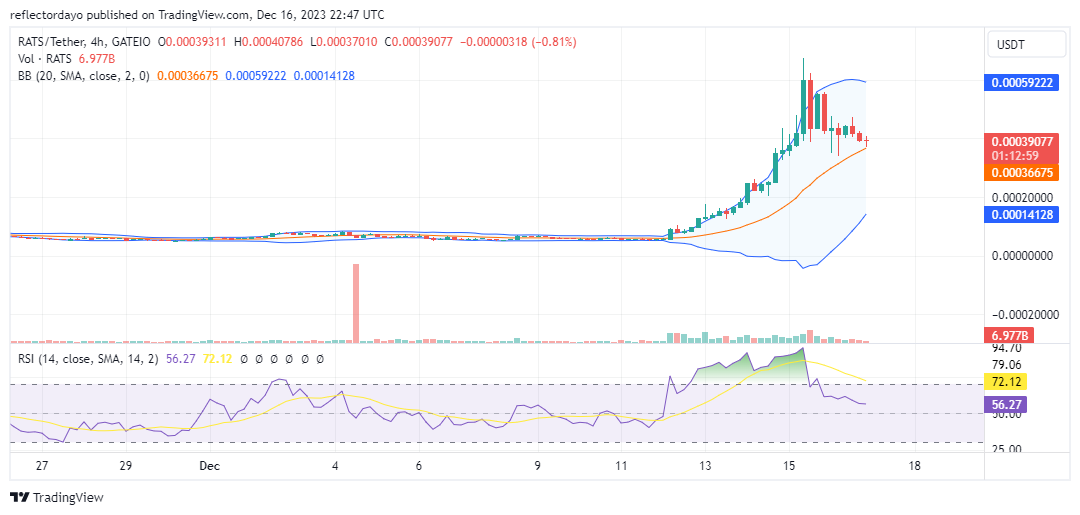
Since historical data first appeared on the chart in November, this market has maintained a relatively stagnant position at the $0.00005874 price level. However, recent developments have added a significant layer of interest this week. Bullish traders have entered the market in force, resulting in a substantial surge in prices to higher levels. Over the past seven days, the price has escalated, reaching the $0.0006 threshold, marking an impressive 566% gain. This substantial increase underscores the market’s volatility, favoring bullish sentiment.
Despite a subsequent retracement after reaching the $0.0006 price threshold, bullish activity remains resilient, with bullish traders showing continued support at around $0.0004 to sustain the aggressive upward trend. Bullish sentiments are notably converging around $0.00004, and a successful establishment of support at this level could pave the way for breaking through the critical resistance at $0.00006.
Current Price: $0.00039
Market Capitalization: $395,141,862
Trading Volume: $175,273,867
Internet Computer (ICP)
Major Bias:Bullish
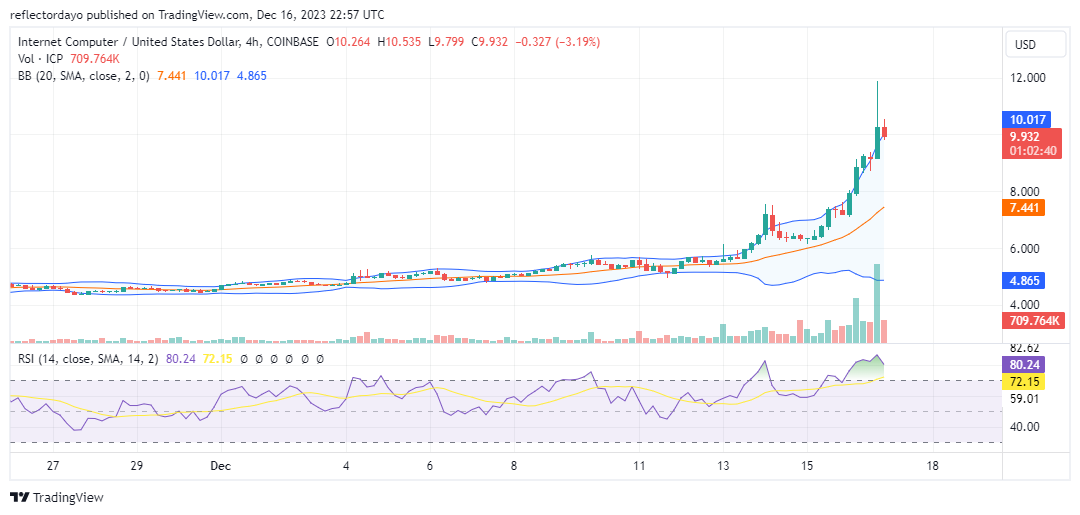
The Internet Computer market, akin to the RATS/USD market, has undergone a substantial bullish surge over the past seven days, securing the fourth position on the list. The resulting bullish activities have induced heightened volatility, propelling the price to a significant surge, reaching the $12.00 price level from its initial position at $5.121—an impressive feat. Throughout the week, the market has realized an 86% gain, and within the last 24 hours alone, a noteworthy 36% increase.
An examination of the market using the Bollinger Bands indicator reveals that the robust bullish momentum has led to a substantial divergence in the upper bands, while the lower band or standard deviation remains relatively stable. This pattern suggests a lack of significant bearish activities, and with the prevailing dominance of bulls, the bullish trend is likely to persist. The ongoing retracement is viewed as a routine price correction, with the overarching trend anticipated to continue.
Current Price: $9.971
Market Capitalization: $4,604,091,759
Trading Volume: $714,256,325
SATS (1000SATS)
Major Bias: Indecision
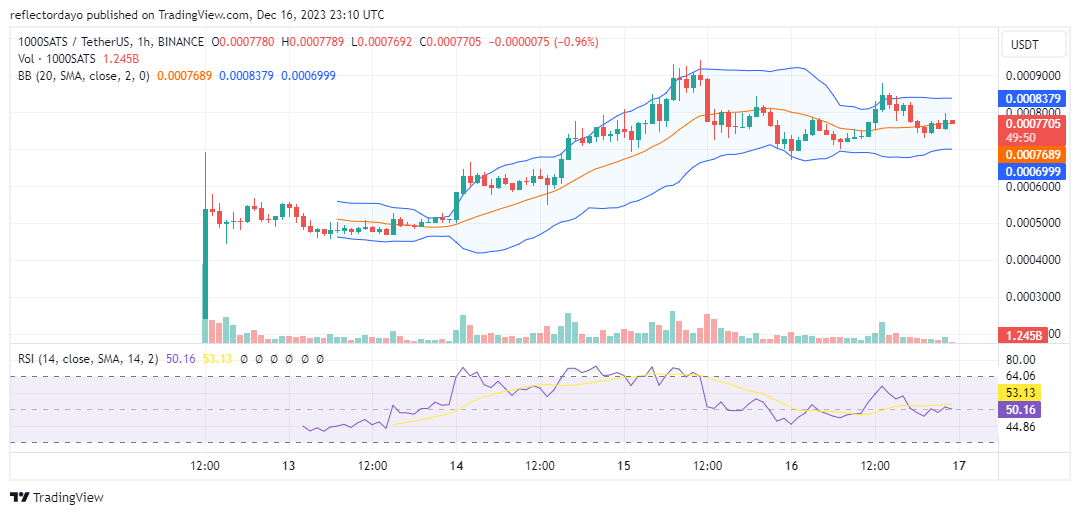
The historical data of this market suggests it may be a newcomer, potentially contributing to its placement as the fifth trending market on this week’s list. Following its settlement at the $0.0005 price level, the market initiated an upward trajectory, reaching the $0.0009 resistance price level. Currently stabilizing at the $0.0007 price level, the bull market appears poised for further developments.
However, a lower high was established on December 16 at the $0.00088 price level, and the price is currently tracking closely with the 20-day moving average. This development indicates a likelihood of price consolidation around the current level, potentially reinforcing the $0.00076 price level as either a support or resistance zone. This observation suggests a phase of market stability and potential strategic positioning for future price movements.
Current Price: $0.00077
Market Capitalization: $1,630,386,875
Trading Volume: $393,090,379