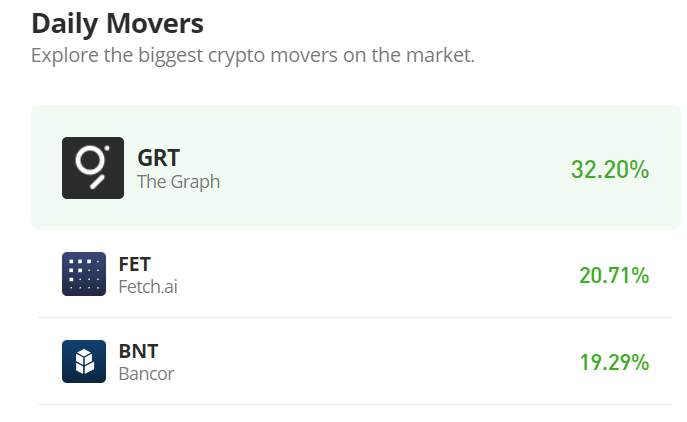
Top Trending Coins for Today, January 7: SEI, BONK, SOL, BTC, and ARB
Estimated Reading Time: 5 minutes
Don’t invest unless you’re prepared to lose all the money you invest. This is a high-risk investment and you are unlikely to be protected if something goes wrong. Take 2 minutes to learn more
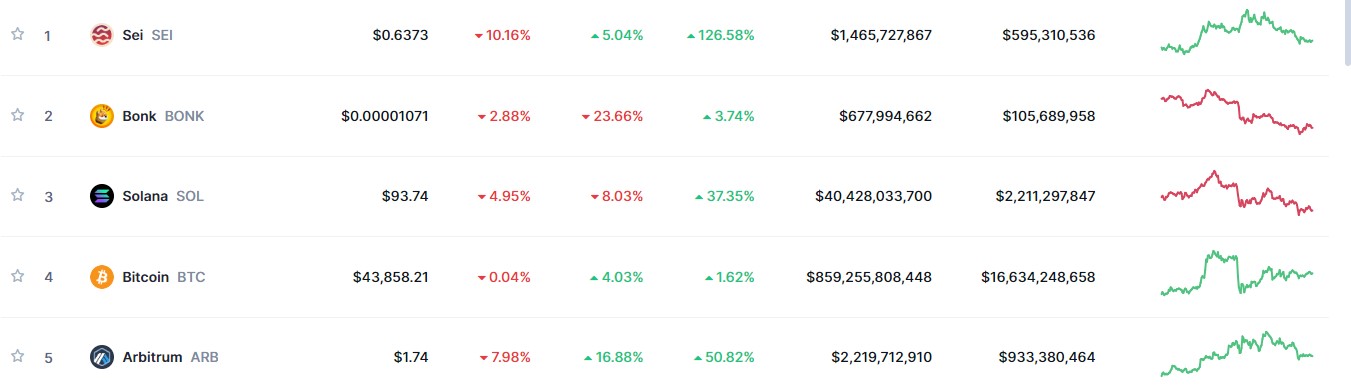
This week presents a compelling selection of leading cryptocurrencies, highlighting significant shifts in the price dynamics of individual digital assets. Notably, recent trading trends, particularly within the last 24 hours, indicate a downturn. Even the foremost market, the Sei market, has experienced the most substantial percentage decline during this period. For a comprehensive understanding, it is essential to analyze each market with precision.
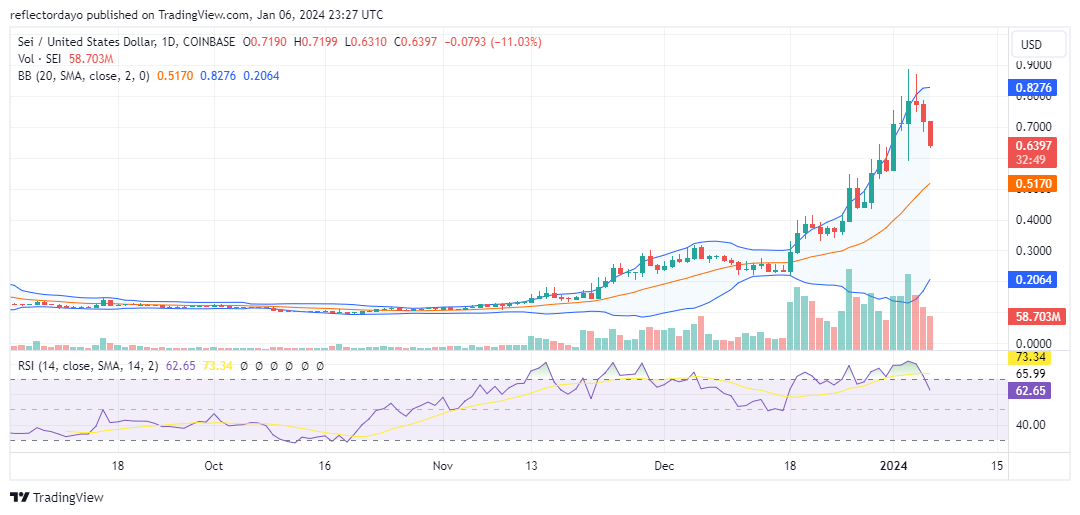
Sei (SEI)
Major Bias: Bearish
In December, the Sei market garnered significant bullish momentum, as evidenced by a substantial increase in trading volume. This bullish trend extended into the new year, specifically on January 1, with prices initially surpassing the $0.700 threshold. However, as prices ventured into the $0.700 to $0.800 range, bearish resistance emerged, evident from pronounced upper shadows in the price charts. Despite this, the bullish sentiment prevented a drop below the $0.700 mark. Subsequent trading days witnessed the bearish side gaining momentum, gradually narrowing the gap with the bulls. The market later peaked near the $0.900 mark, after which the bearish sentiment intensified. Today’s trading session was predominantly bearish, devoid of any bullish indications. This pronounced selling activity likely propelled the market to the top position on our list for the day, with a decline of 10.16% over the past 24 hours.
Current Price: $0.6373
Market Capitalization: $1,465,727,867
Trading Volume: $595,310,536
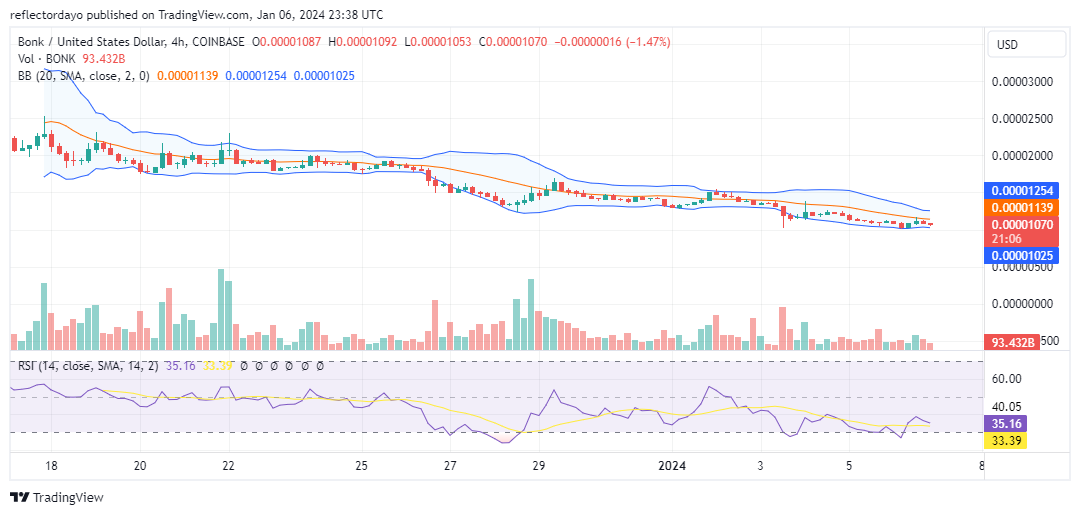
Bonk (BONK)
Major Bias: Bearish
In the second position is the Bonk market. Likely due to its recent launch, this market has garnered significant attention from traders and analysts alike, ranking as the second most searched market for the week. Despite not exhibiting pronounced bullish or bearish movements, the Bonk market has consistently appeared on top trending lists in recent weeks. As of the time of this analysis, the market has incurred a substantial loss of 23.66% over the past seven days, with gains over the last 30 days amounting to a modest 3.74%. Upon examination of the 4-hour chart, while the market may seem to move sideways, a closer look at the Bollinger Bands indicator suggests a downward price channel. Nevertheless, there remains potential for a bullish resurgence, particularly around the $0.000010 price level.
Current Price: $0.00001071
Market Capitalization: $.677,994,662
Trading Volume: $105,689,958
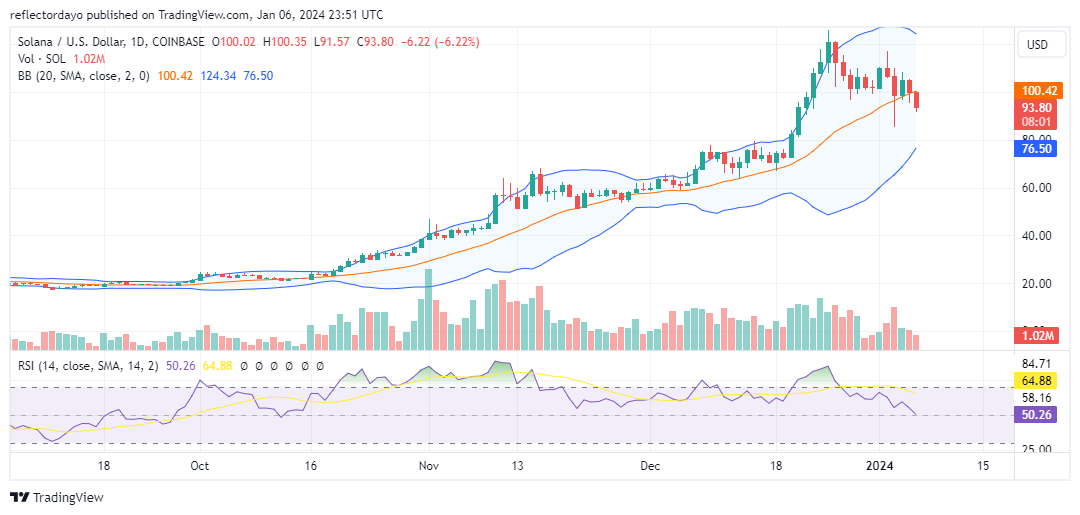
Solana (SOL)
Major Bias: Bearish
Similar to the Bonk market, the Solana market has consistently appeared among the top trending markets in recent weeks. However, Solana distinguishes itself by demonstrating notable gains, pushing its price to the $120 threshold. Solana’s bullish momentum culminated on Christmas Day of 2023, with a bearish reversal initiated around $126. Despite this, bullish support emerged around the $100 mark, establishing it as a pivotal support level and temporarily halting further declines. This equilibrium between supply and demand persisted into the new year, until the market breached the $100 support. This recent market shift has led the Bollinger Bands to converge. Should bullish traders fail to reclaim the market around the $80 level, the subsequent demand level may be around $68.62.
Current Price: $93.66
Market Capitalization: $40,428,033,700
Trading Volume: $2.211,297,847
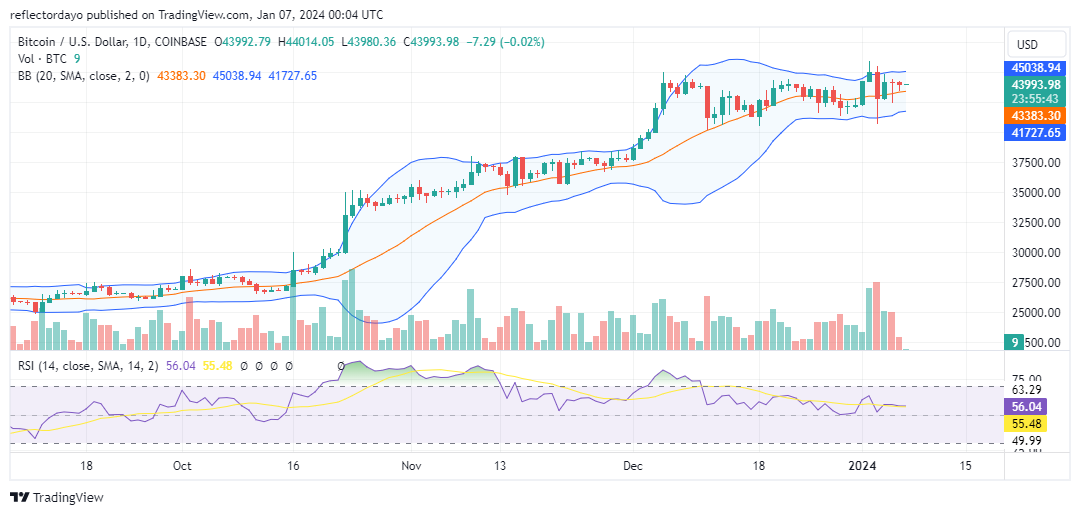
Bitcoin (BTC)
Major Bias: Indecision
In the fourth position, we have Bitcoin, often referred to as the Kingcoin. Throughout the week, the Bitcoin market has been a focal point on social media platforms, as it has made concerted efforts to breach the $45,000 price threshold. However, persistent clashes between bullish and bearish sentiments have led the market to consolidate within the $40,000 to $45,000 price range. The recent price action, represented by the last two daily candles, underscores a significant tug-of-war between the bulls and bears. While indicators suggest that this consolidation is occurring within a bullish zone, potentially favoring the bulls, there remains a possibility of continued consolidation. Furthermore, a decline in trading volume suggests potential consolidation or retracement, with the $40,000 level possibly serving as a support level from which a rebound could occur.
Current Price: $43,858
Market Capitalization: $859,255,808,448
Trading Volume: $16,634,248,648
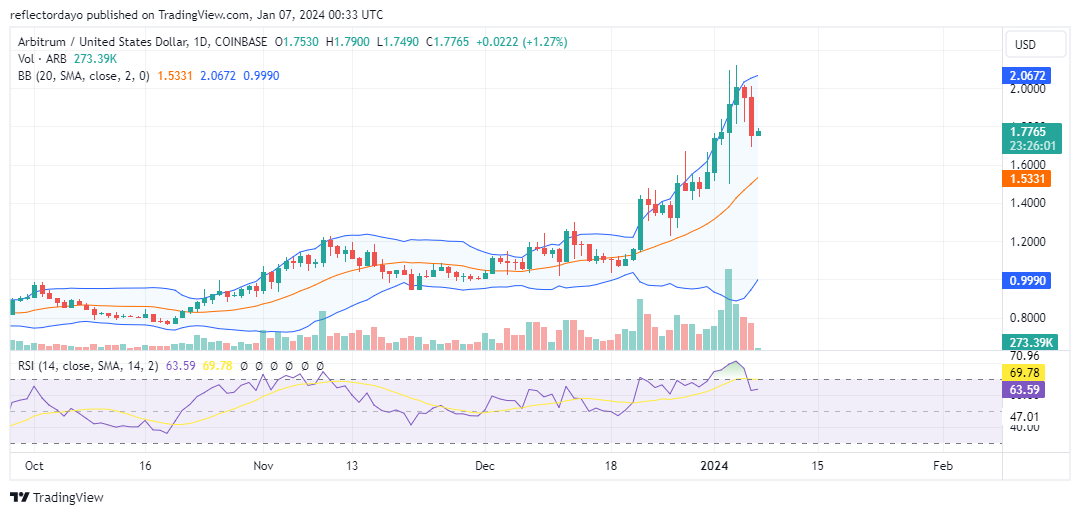
Arbitrum (ARB)
Major Bias: Bullish
Similar to many markets that witnessed significant bullish momentum in the final quarter of 2023, the Arbitrum market experienced a notable price surge, reaching a peak of $2.11 on January 4, before the onset of a bearish phase. However, based on market dynamics observed on January 6, it appears that bullish activity is emerging around the $1.7556 price level. The current price movement, characterized as a mere retracement, does not necessarily signify waning bullish sentiment. Indeed, bullish sentiment appears to remain robust. Analyzing the Relative Strength Index (RSI), the price downturn appears to be a routine correction from overbought conditions. The underlying bullish sentiment may still be intact, especially considering the presence of a lower shadow in the January 6 candlestick, suggesting potential bullish efforts to reclaim the prevailing trend.
Current Price: $1.74
Market Capitalization: $2,219,712,910
Trading Volume: $933,380,464