Lucky Block Price Prediction: LBLOCK/USD Retreats Below $0.00020; Buy Now
Estimated Reading Time: 3 minutes
Don’t invest unless you’re prepared to lose all the money you invest. This is a high-risk investment and you are unlikely to be protected if something goes wrong. Take 2 minutes to learn more
Lucky Block Price Prediction – October 21
The Lucky Block price prediction shows that LBLOCK stays below the 9-day and 21-day moving averages as the price becomes very cheap.
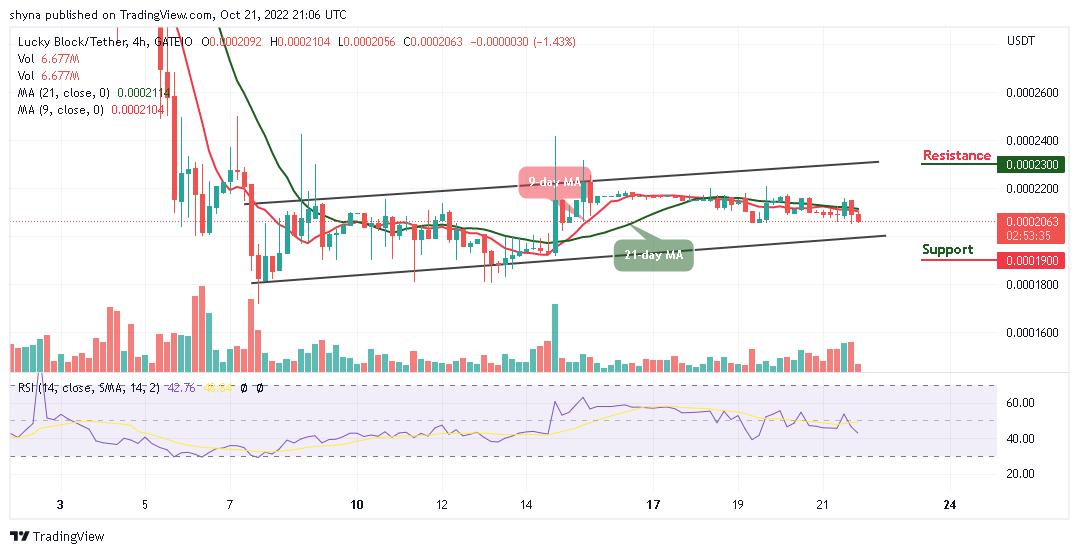
LBLOCK/USD Medium-term Trend: Ranging (4H Chart)
Key Levels:
Resistance levels: $0.00023, $0.00024, $0.00025
Support levels: $0.00019, $0.00018, $0.00017
LBLOCK/USD is preparing for the next upsurge as the coin trades around $0.00020. The coin will begin to trade bullishly as the bulls step back into the market. This is necessary for the coin to reach higher resistance levels as the existing buyers are expected to buy the dip. Meanwhile, if the sellers bring the market further lower, bears can expect immediate support to be located towards the lower boundary of the channel.
Lucky Block Price Prediction: LBLOCK/USD Could Face a Retracement
The Lucky Block price consolidates below the 9-day and 21-day moving averages and this would be a good opportunity for the existing buyers to buy the dip should the coin falls more. Moreover, the technical indicator Relative Strength Index (14) is moving to cross below the 40-level as any bearish movement below the lower boundary of the channel could find support at $0.00019, $0.00018, and $0.00017.
However, if the buyers hold the current market value and push it to cross above moving averages, the bulls can expect a break towards the upper boundary of the channel, any further bullish movement could hit the resistance levels at $0.00023, $0.00024, and $0.00025.
LBLOCK/USD Medium-term Trend: Bearish (2H Chart)
On the 2-hour chart, the Lucky Block (LBLOCK) is sliding below the 9-day and 21-day moving averages as the coin touches the support T $0.000205, which becomes so cheap for the new and existing buyers to invest more.
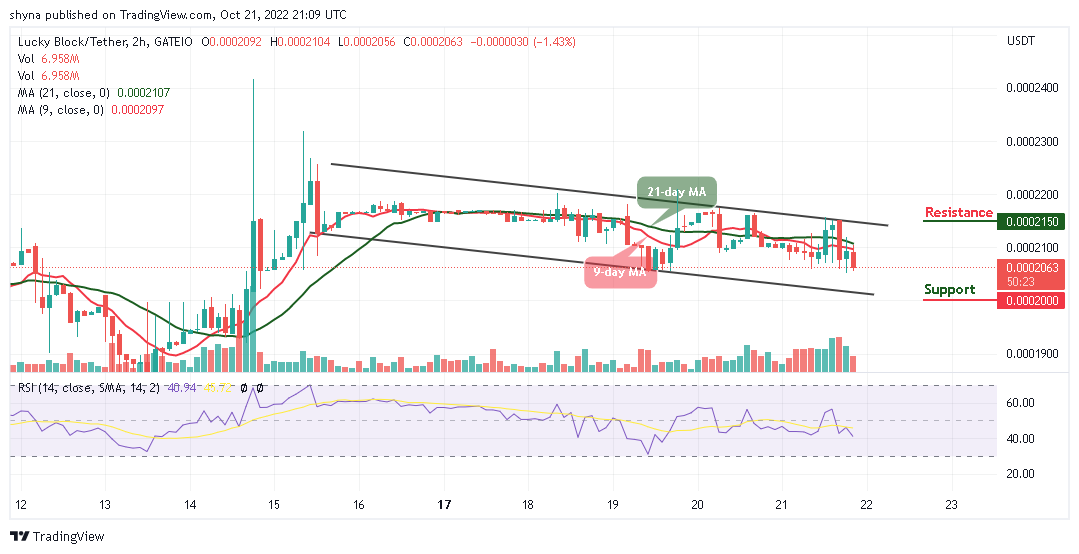
From above, buyers are gaining momentum as they are ready to push the coin above the moving averages, higher resistance could be located towards the upper boundary of the channel at $0.000215 and above. Therefore, any bearish movement below the channel could hit the support level at $0.00020 and below while the technical indicator Relative Strength Index (14) moves to cross below the 40-level.
You can purchase Lucky Block here. Buy LBLOCK