Top Trending Coins for Today, October 5: HMSTR, BTC, LUNARLENS, SUI, and SOL
Estimated Reading Time: 5 minutes
Don’t invest unless you’re prepared to lose all the money you invest. This is a high-risk investment and you are unlikely to be protected if something goes wrong. Take 2 minutes to learn more
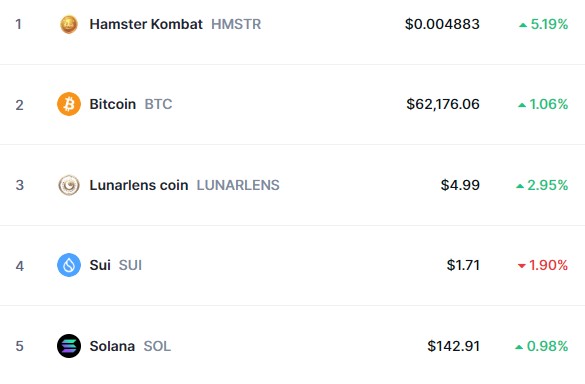
Memecoins remain at the top of trending assets, with Hamster Kombat (HMSTR) leading and Bitcoin close behind. Despite this, the broader market has slowed, though Bitcoin holds strong above $60,000. We’ll now analyze the technical performance of this week;s list of trending market, as Hamster Kombat dominates memecoins and Bitcoin stays steady amid the sluggish trend.
Hamster Kombat (HMSTR)
Major Bias: Indecision
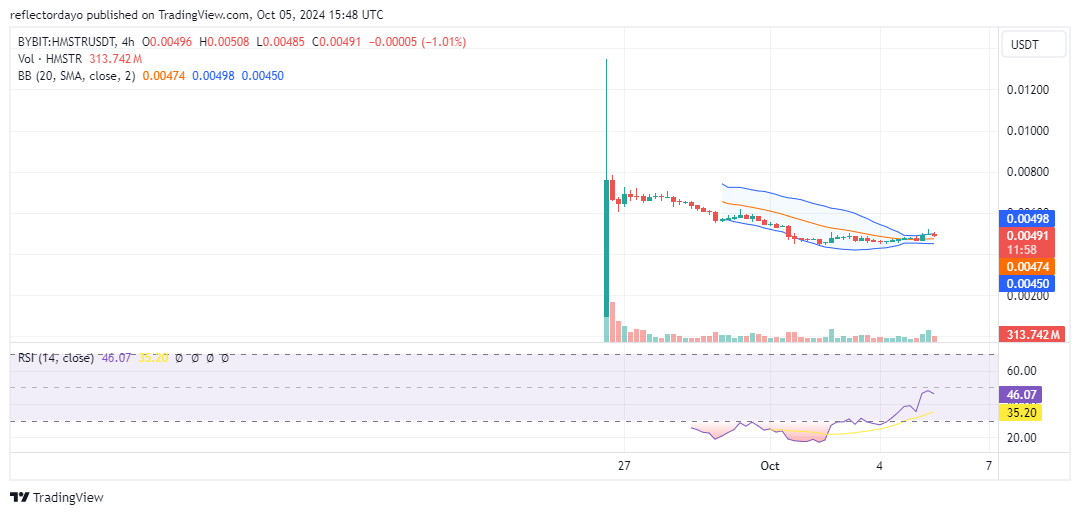
Aside from the initial surge on the first day, the market has largely started on a bearish note, having lost approximately 42% from its rise to $0.0078 down to around $0.0045, where it found support during the concluding week. The market has faced significant bearish pressure, but after establishing solid support at the $0.0045 level on October 2, it has managed a slight rally, though the pressure remains strong.
Previously, the Relative Strength Index (RSI) indicated that the market was oversold, trading below its intrinsic value. However, the RSI has since recovered to around the 46 level. Despite this recovery, the last two 4-hour trading sessions have formed doji candlesticks, signaling indecision and suggesting that bearish bias persists. This could indicate the continuation of the current consolidation phase.
Current Price: $0.0049
Market Capitalization: $ 314 million
Trading Volume: $114 million
Bitcoin (BTC)
Major Bias: Bullish
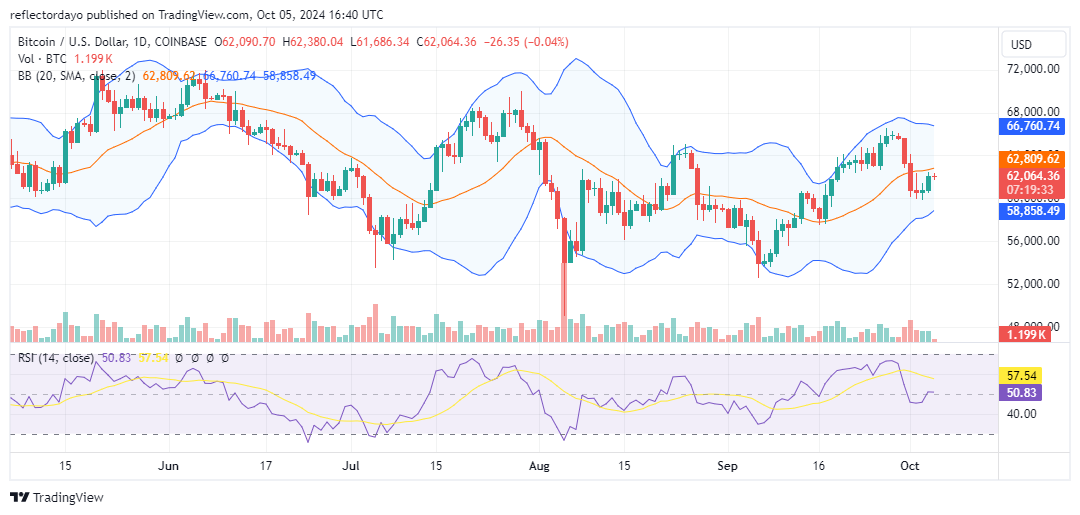
The Bitcoin market has maintained its second position from last week, regaining momentum and pushing back above the $60,000 level. Last week, the market gained enough strength to peak above the $64,000 mark. However, by the end of September, Bitcoin fell below this level. With the start of October, the market found strong support at the $60,000 threshold and began to rally from that point.
However, early in this bullish recovery, the current trading session is forming a doji pattern, which often signals indecision, which can also be taken for a classic bearish signal. This suggests that bulls are already in a standoff with bears early in the rally. If this does not lead to a breakdown below the $60,000 level, it could result in a period of consolidation, with the price ranging sideways before finding a clear direction.
Current Price: $62,077
Market Capitalization: $ 1.2 trillion
Trading Volume: $18 billion
Lunarlens coin (LUNARLENS)
Major Bias: Indecision
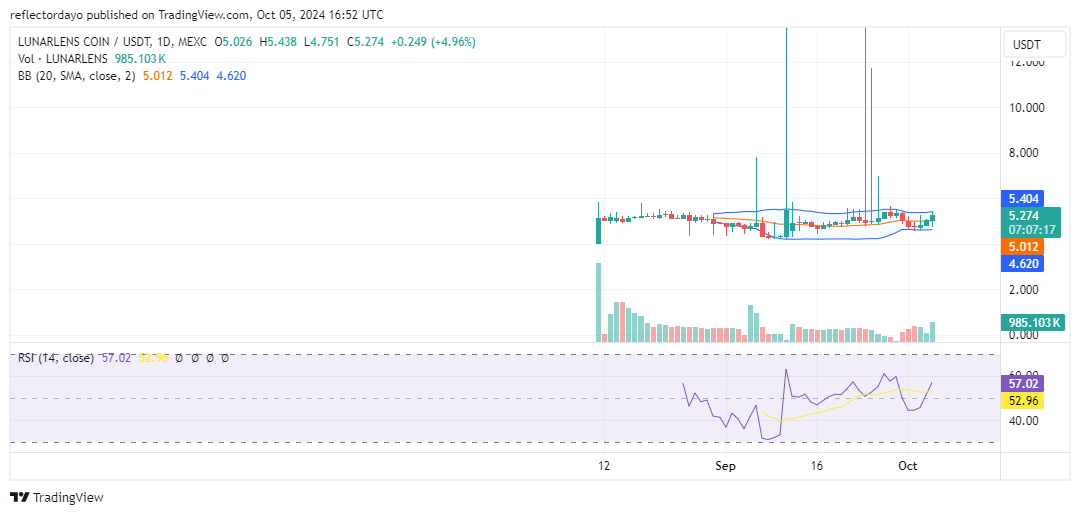
In third place on the trending list is Lunarlens coin, a relatively new market with historical data beginning on August 11. So far, the market has shown no clear divergence in favor of either bulls or bears, instead maintaining a range around the $5.00 price level.
A review of the chart reveals repeated upper shadows on the candlesticks, which are now descending. This crypto signal indicates that the market may be preparing for a break below the $5.00 level. If that happens, the $4.00 price level could act as support and potentially serve as a launchpad for a bullish recovery.
The upper shadows on the candlesticks signify that buyers have been driving prices higher, but sellers are stepping in and forcing the price back down. This is a sign that bullish momentum is weakening. In technical analysis, this pattern is typically viewed as a bearish signal. The descending upper shadows suggest that the market is losing bullish strength, with the potential for a breakdown below the current consolidation level. A break below horizontal support could confirm the start of a bearish move.
Current Price: $5.18
Market Capitalization: $99.7 million
Trading Volume: $7 million
Sui (SUI)
Major Bias: Bullish
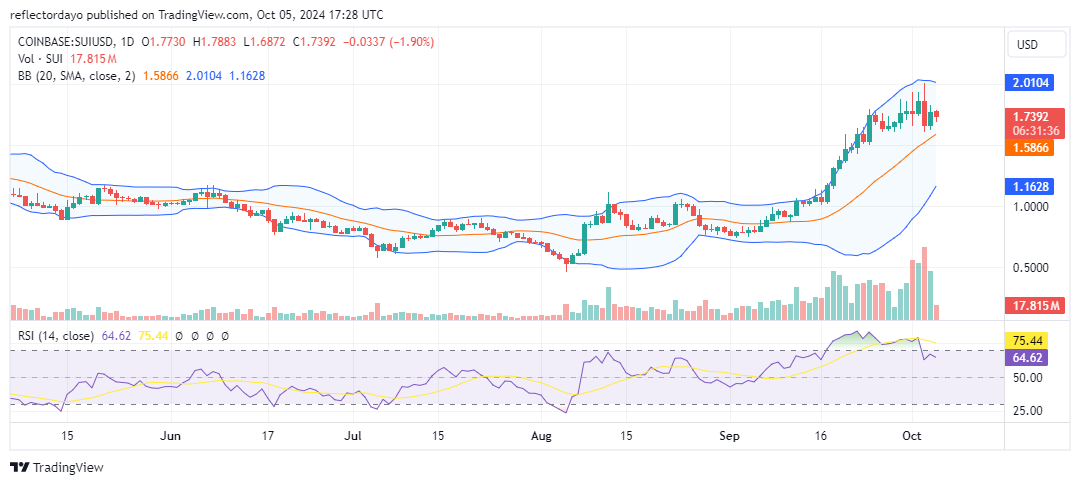
Over the past few days, the Sui bull market has been relentless. However, this week, after reaching the $2.00 price mark, the market has entered a consolidation phase, trading within the elevated price range of $1.60 to $2.00. The strong and sustained bullish momentum has significantly increased market volatility.
Given the current indications on the chart, especially the RSI, one might expect a potential correction from the $2.00 level, where traders have set a bearish bias with sell orders. Despite this, the market has held above the $1.60 level, which briefly acted as resistance on the 21 and 22 of September. This suggests that the market still has a bullish inclination, as it remains buoyant above the $1.60 threshold.
The market retains enough bullish strength to maintain its position, and it will be important to monitor what unfolds in the coming week.
Current Price: $1.74
Market Capitalization: $4.7 billion
Trading Volume: $560 million
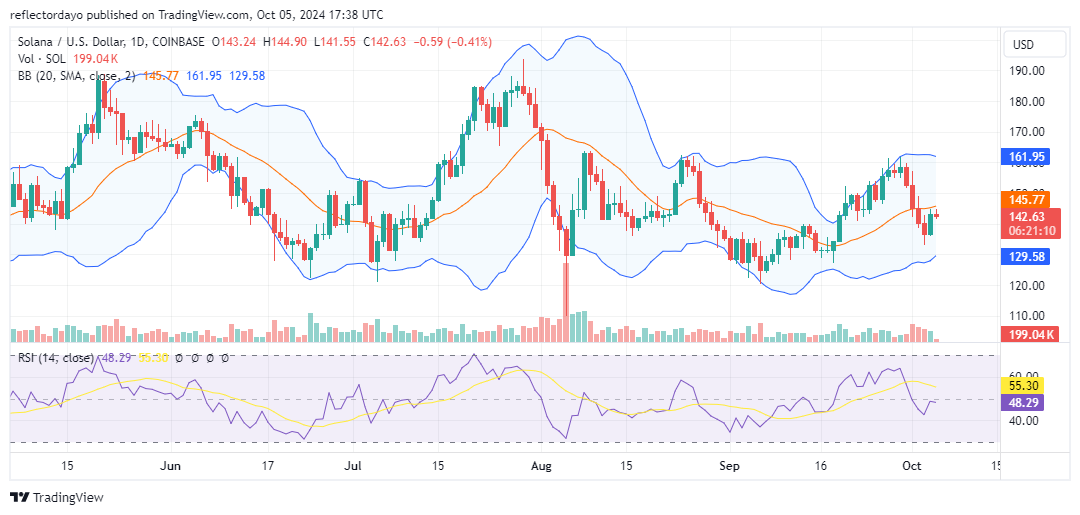
Solana (SOL)
Major Bias: Bullish
The Solana market closed September on a bearish note, with the price falling from the $160 level. This correction was significant, as illustrated by the bearish candlestick that showed a drop to the $136 support level. After finding support at this level, the market recovered notably in yesterday’s session, surging above $140.
However, in today’s trading session, the market appears stagnant, hovering around the $142 mark. Although there was a price surge yesterday, trading volume was slightly lower than the previous day, signaling potential exhaustion on the part of the bulls.
If bearish momentum prevails, the $140 level should act as a key support, a point where the market could potentially bounce back.
Current Price: $142
Market Capitalization: $66.7 billion
Trading Volume: $1.3 million