Universal Market Access (UMA/USD): Bulls Secure a Breakthrough at $1.17
Estimated Reading Time: 3 minutes
Don’t invest unless you’re prepared to lose all the money you invest. This is a high-risk investment and you are unlikely to be protected if something goes wrong. Take 2 minutes to learn more
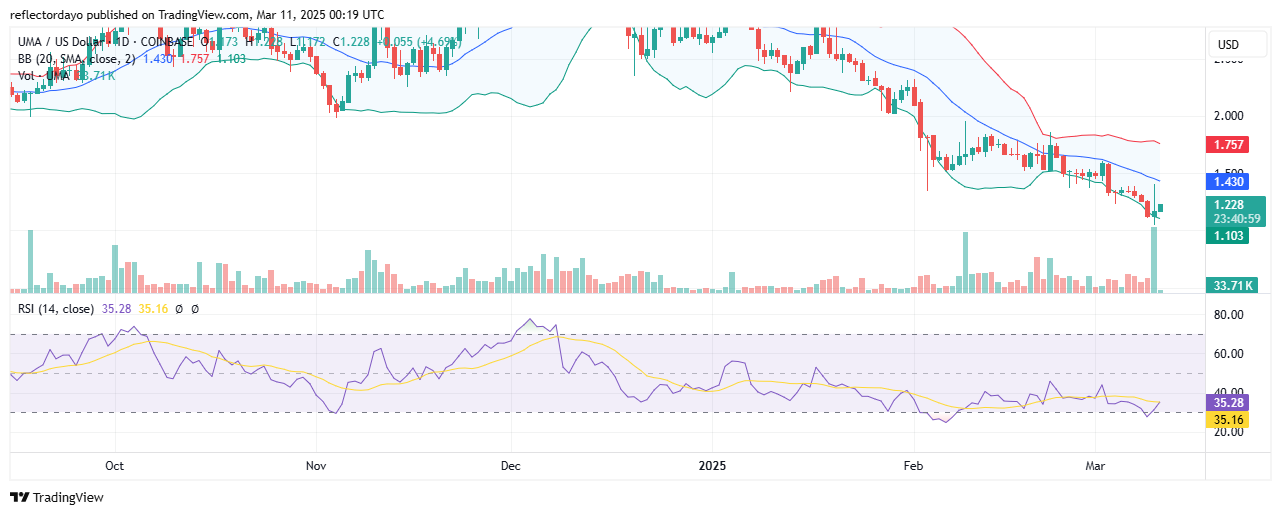
The Universal Market Access (UMA) token has been driven to lower price levels as the bearish trend remains unrelenting, with bulls consistently failing to reclaim control at key resistance levels. Initially, the emergence of bullish sentiment around the $1.50 price level led to a period of consolidation, but in March, buyers lost momentum, causing the market to decline further.
In the previous daily trading session, there were signs of intense competition between supply and demand, as indicated by strong price swings and a significant increase in trading volume. Following this struggle, the market has made a decisive upward move in the current session. At present, a moderate green candle is forming, signaling a potential retracement toward the $1.50 level.
Universal Market Access Data
- UMA/USD Price Now: $1.2
- UMA/USD Market Cap: $102 million
- UMA/USD Circulating Supply: 85.7 million UMA
- UMA/USD Total Supply: 123.76 million UMA
- UMA/USD CoinMarketCap Ranking: #296
Key Levels
- Resistance: $1.40, $1.50, and $1.60
- Support: $1.00, $0.90, and $0.85.
Universal Market Access Through the Lens of Indicators
There is a moderate bounce following a prolonged struggle, but does this indicate that the Universal Market Access bulls have finally regained enough strength to rally toward the $1.50 price level?
From the indicators, the ongoing session is still showing a small candlestick, and the trading volume histogram remains low, making the sustainability of this recovery uncertain. However, a deeper analysis of the indicators could provide insight into potential market sentiment and the next direction.
The previous daily candlestick resembles a shooting star—a candle with a long upper shadow and a small lower shadow. When this pattern appears at the bottom of a downtrend, it often signals a strong bullish presence at that level. Despite this crypto signal, bearish pressure remains, and the weak trading volume suggests that the bullish recovery could be losing momentum.
Notably, the RSI’s faster and slower lines have formed a bullish crossover, which could be an early sign of further upside movement. However, traders may want to observe whether this recovery can sustain itself up to the $1.30 price level.
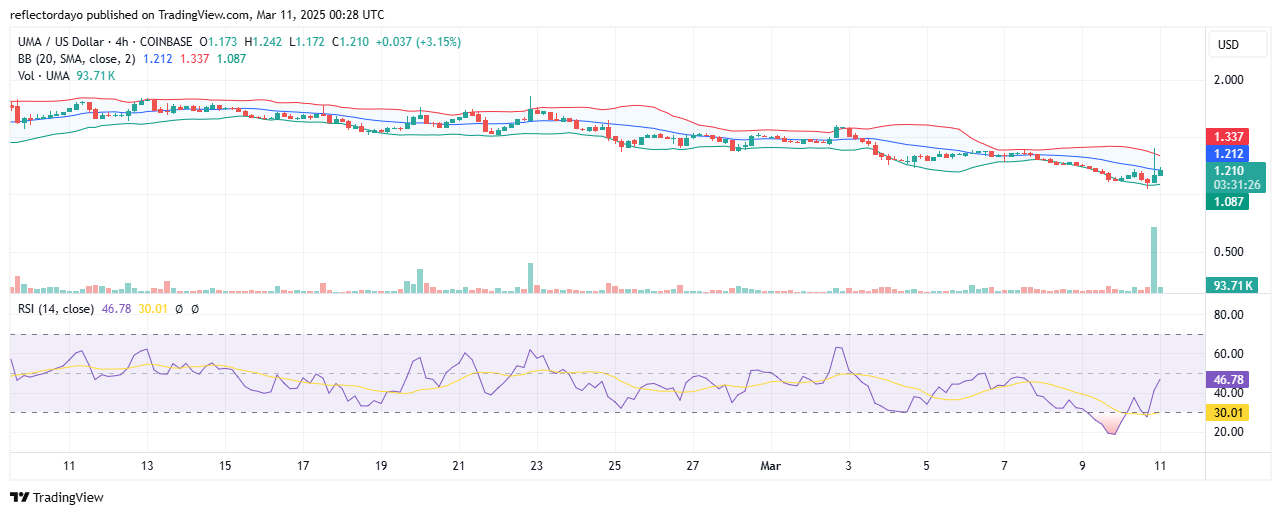
UMA/USD Price Prediction: 4-Hour Chart Analysis
Zooming into the smaller time frame, we observe that the $1.30 price level was a key consolidation zone, where the market moved sideways for a while before eventually breaking down. This breakdown triggered a significant spike in market volatility, which likely explains the sharp price swings that followed.
However, as the market now trends upward, the Bollinger Bands indicator shows a reduction in volatility, with the bands converging. This contraction suggests that the market may be entering another consolidation phase until the bulls accumulate enough momentum to drive a breakout.