Zcash (ZEC/USD) Surges Towards $27 Resistance
Estimated Reading Time: 3 minutes
Don’t invest unless you’re prepared to lose all the money you invest. This is a high-risk investment and you are unlikely to be protected if something goes wrong. Take 2 minutes to learn more

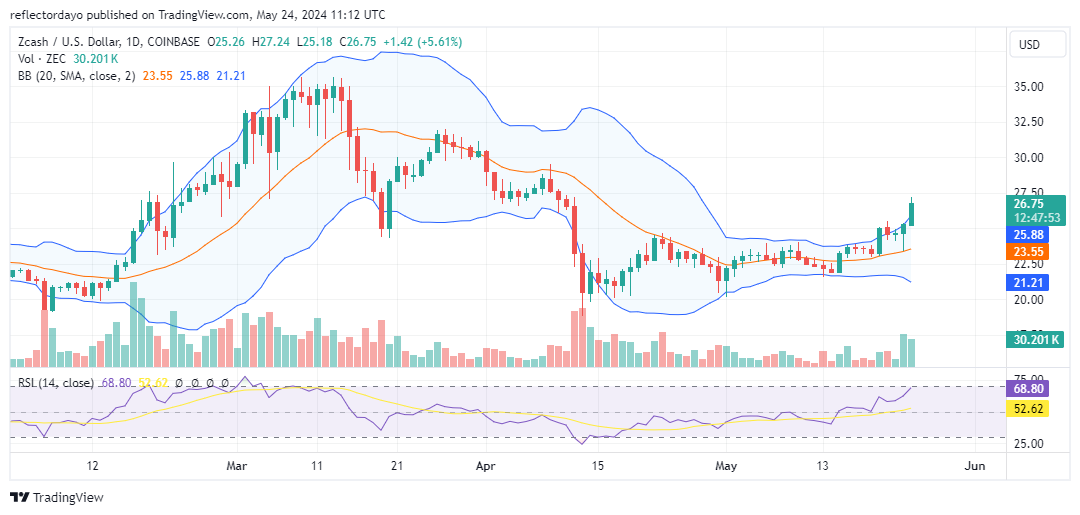
During the last bull run, the Zcash market peaked at $35, triggering a bearish decline to the $20 level. This support level has been longstanding since January 2024. Consequently, the general sentiment is that the market will likely bounce back rather than break below this level, especially given the rapid bullish response observed, causing the price action to bounce twice. This crypto signal has further strengthened the support level.
As a result, ascending lows began to form, culminating in a break above the crucial $25 resistance level. This resistance has been in place since April, after the bearish market was halted by bullish intervention at the $20 level.
Zcash Market Data
- ZEC/USD Price Now: $26.75
- ZEC/USD Market Cap: $436 million
- ZEC/USD Circulating Supply: 16 million
- ZEC/USD Total Supply: 16 million
- ZEC/USD CoinMarketCap Ranking: #161
Key Levels
- Resistance: $27.00, $27.50, and $28.00
- Support: $25.00, $24.50, and $23.50.
Zcash Market Through the Lens of Indicators
The break above the $25 resistance level appears to have triggered a surge of bullish sentiment in the market, as evidenced by a significant bullish candlestick on the daily chart. However, some Zcash traders may be targeting the $27.50 level for profit-taking, which explains the upper shadow. Despite this, the prevailing market sentiment remains predominantly bullish, supported by a substantial increase in trading volume, as indicated by the trade volume histogram.
Nevertheless, according to the Bollinger Bands, which are showing diverging standard deviations, there is a potential for another faceoff between bulls and bears around the $27.50 level. If the bulls can maintain their grip at this level, they could keep the market on course to reach the peak of the last bull run in March, which was $35.
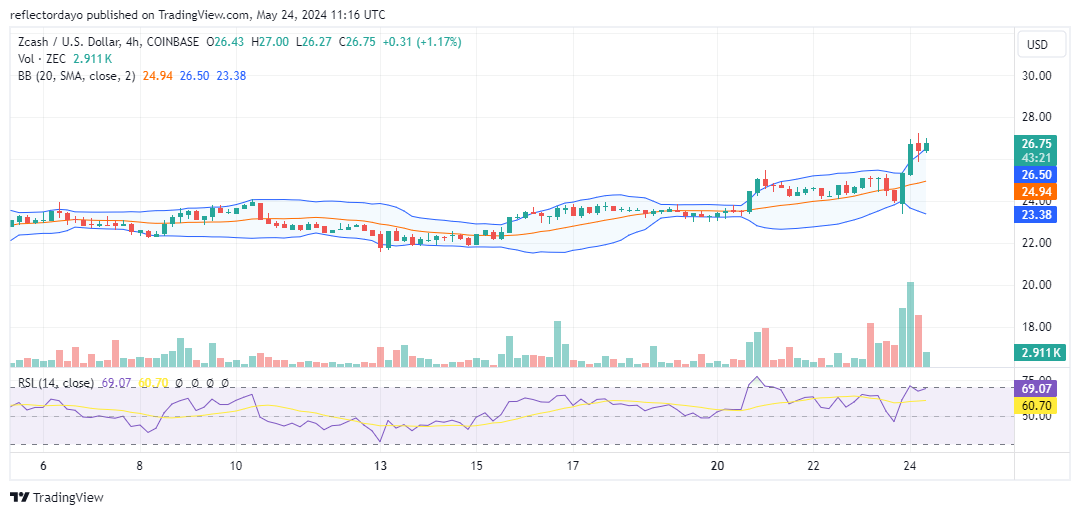
ZEC/USD Price Prediction: 4-Hour Chart Analysis
The smaller timeframe indicates that the market has encountered notable resistance around the $26.85 price level, with price action suggesting that demand and supply are becoming evenly matched. The trade volume indicator is beginning to show a significant decline, likely due to the stalemate between bulls and bears. Bulls need to maintain their position at this level to ensure the market continues on a bullish course.